Cuadro-OLD
Table of Contents
Overview:
The Grid reports group stores in 4 categories based on their productivity and service level for a given period.
How is it Useful?
The Grid report compares the stores’ average with all other stores’ average in the selected chain/region and ranks them in 4 categories:
GSGP: Good Service, Good productivity
GSPP: Good Service, Poor productivity
PSGP: Poor Service, Good productivity
PSPP: Poor Service, Poor productivity
The report provides an overview of the area for improvements for each stores.
We suggest you compare the same type of stores (factory, strip mall, stands alone, etc.) since each store type would have different trend of data and various customer types. You are going to get better and more precise reports analyzing that way.
Who would normally use this report?
Usually used by district or head office managers to understand on which store(s) to focus for improvements.
Steps:


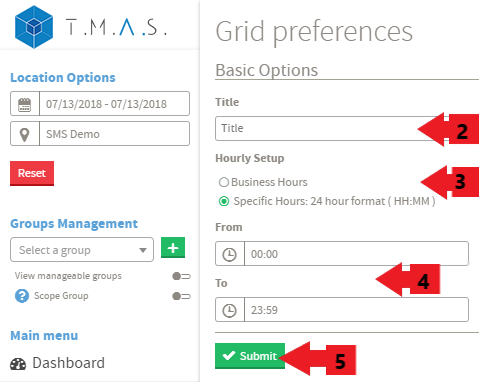
After selecting the desired location. date/time for to include in the reports, perform the following.
- Select the Grid Report
- Input the title name of your choice.
- Click on Business Hours or Specific Hours;
- If you selected Specific Hours, Input the desired value;
- Select Submit;
- Select Schedule if you wish to have it automated (See Report Scheduling for more details);
Result:
