4 Graphs
Retailers - Compare up to four (4) variables in a printable format
Table of Contents
Overview
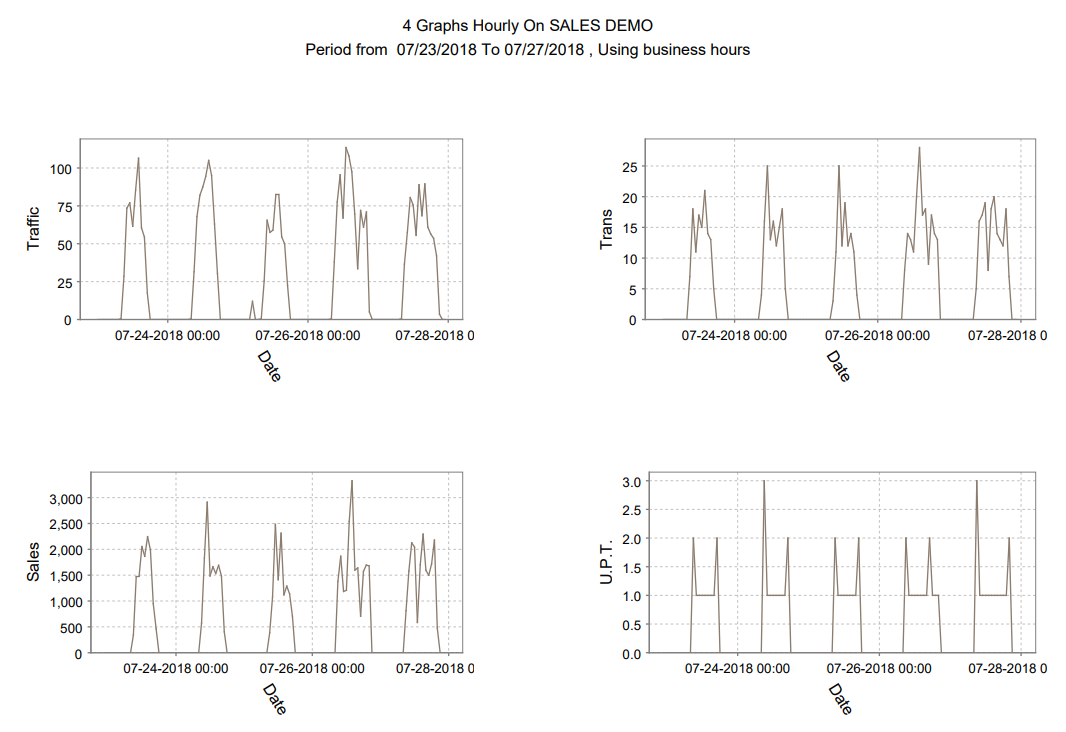
The 4 Graphs generate four (4) independent graphics, one for each selected variable, in a PDF document that can be printed
How is it Useful?
The fact that the four (4) graphics are independent maximize clarity when comparing more than 2 variables over a given period. This allows to understand the trend of every selected variable with a glimpse.
Who would normally use this report?
Retail users
Steps:
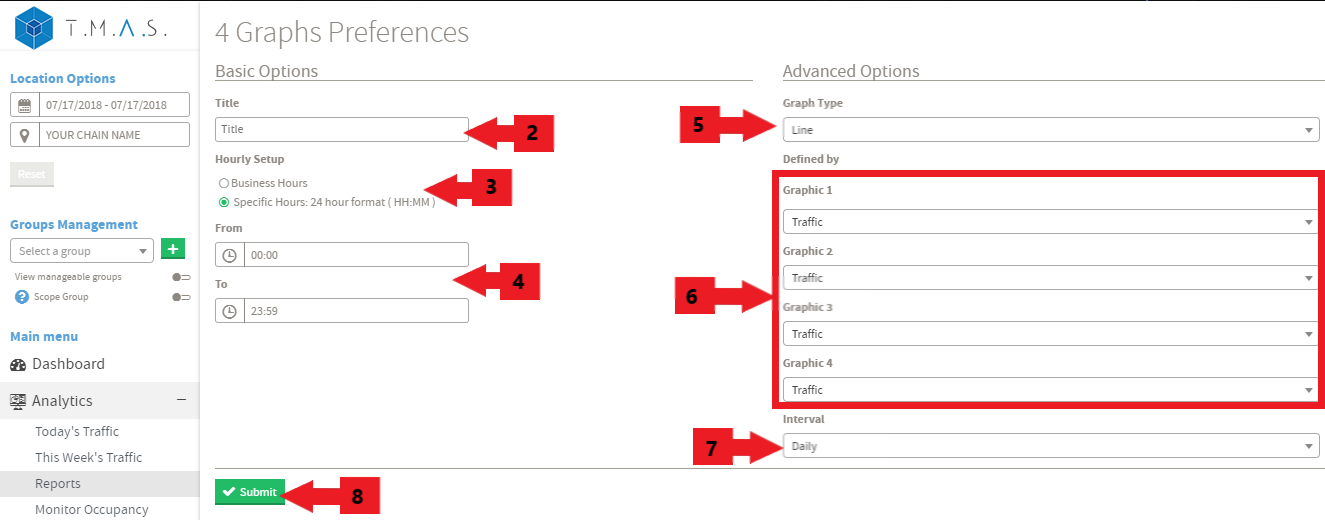
We assume that you have picked the location and date that you want to include in the reports.
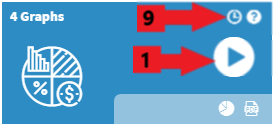
- Select the 4 Graphs Report.
- Input the title name of your choice, this is optional;
- Click on Business hours or Specific Hours;
- If you selected Specific Hours, Input the desired value;
- Select the Graph Type (Line, Bar or Area);
- Select the “Defined by” and select the 4 options to include;
- Select the desired interval;
- Click Submit;
- Click Schedule if you wish to have it automated (See Report Scheduling for more details);
Result: