Comparación de días de la semana
Table of Contents
Overview:
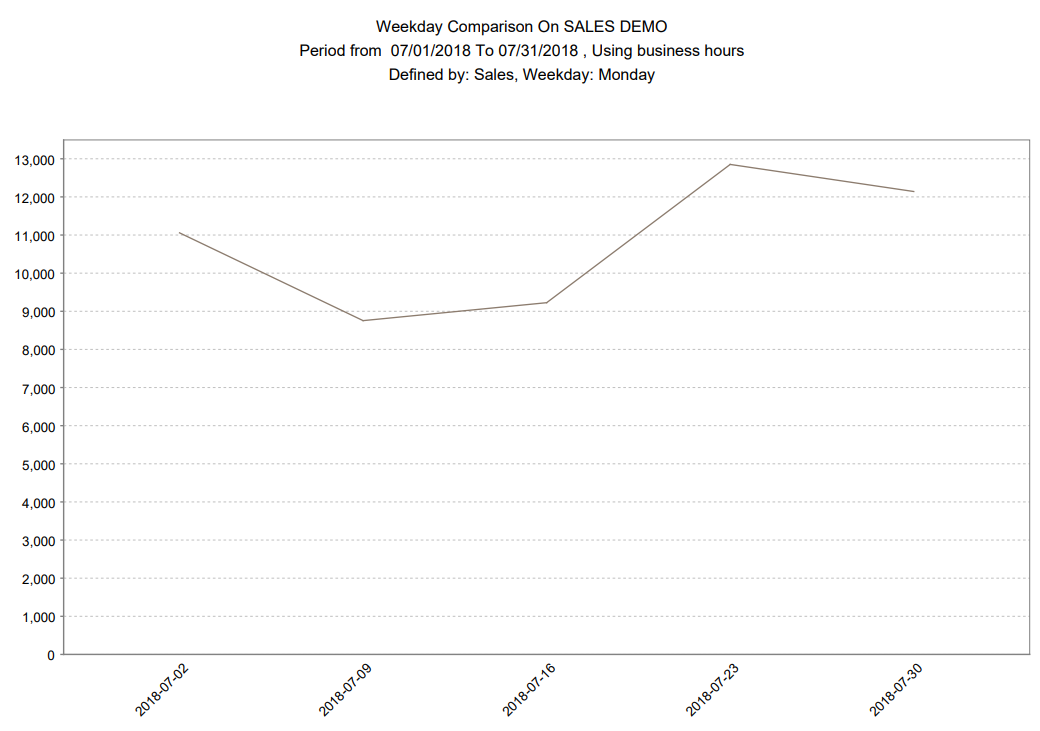
This graphic shows you the changes week-by-week for the selected weekday, over the time period entered. More than one week of data must be specified in order for this report to be useful.
How is it Useful?
It gives you a focused view of the performance of a specific weekday and how it has evolved over time. As an example, it would be ideal to run this report on Saturdays if that is your biggest day and you want to see if traffic has increased for this weekday over a given period.
Who would normally use this report?
Everyone
Steps:
We assume that you have picked the location and date that you want to include in the reports.
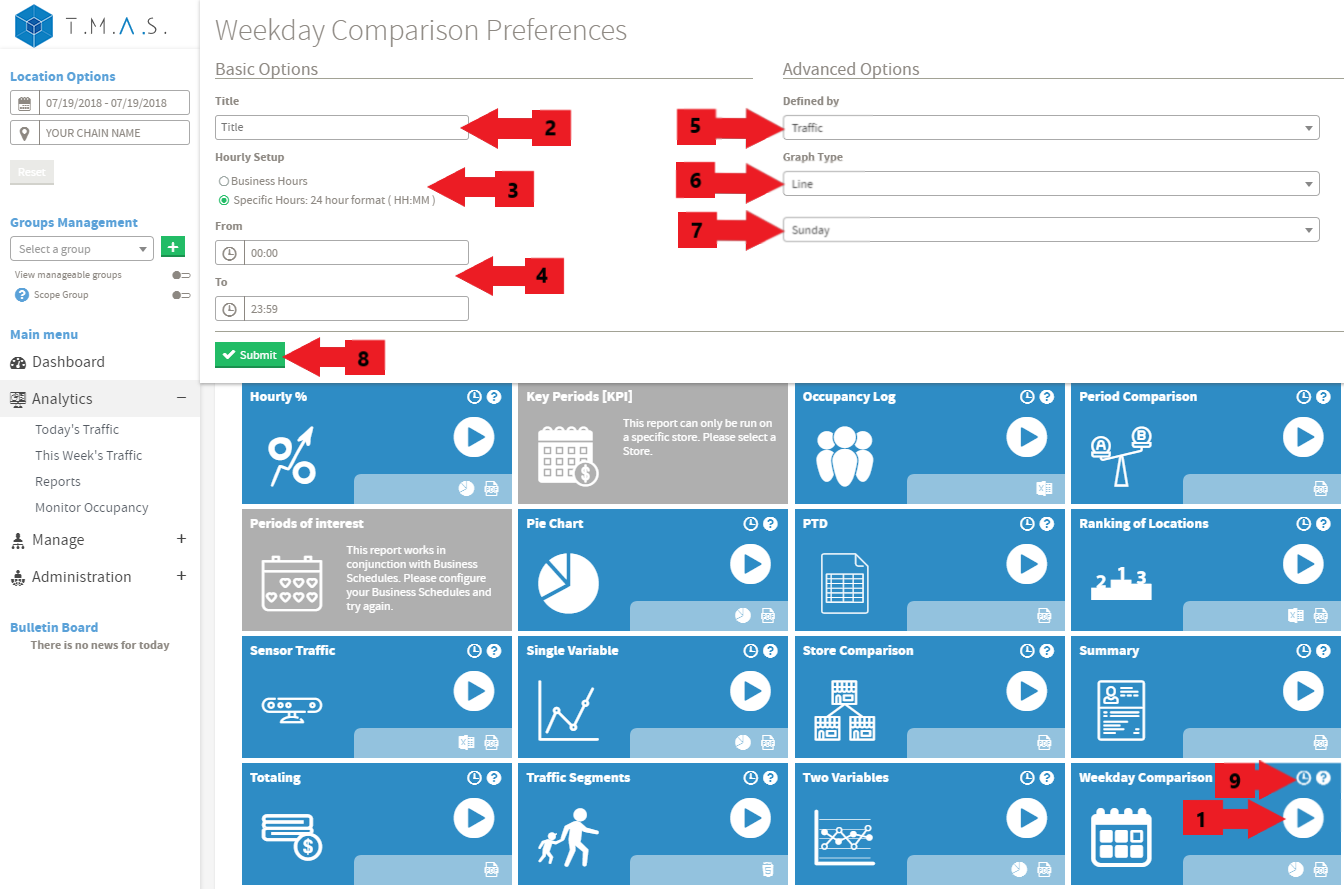
- Select the Weekday Comparison Report.
- Input the title name of your choice, this is optional;
- Click on Business hours or Specific Hours;
- If you selected Specific Hours, Input the desired value;
- Select the “Defined by” variable for the report;
- Select the desired Graph Type;
- Select the desired Interval;
- Click Submit;
- Click Schedule if you wish to have it automated (See Report Scheduling for more details);
Result: