Retail Equation Playground
Dashboard
Table of Contents
Overview
The purpose of the Retail Equation Playground is to understand the influencing factors of Sales totals for a single day, week, month or year. Use it to increase sales by seeing how improvement can be made to past dates and how manipulating values such as traffic, % sold (conversion), staff hours, as well as average sales and transactions can contribute to successfully achieving set goals. Also R.E.P. can be used as a store associates / manager training tool for staff to visualize and comprehend how important they are to help define the bottom line.
How to get to the playground
- Login to T.M.A.S.
-
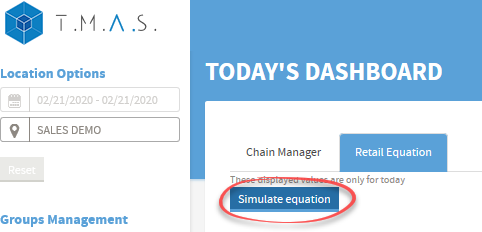
Select Simulate equation from the Retail Equation tab of "Today's Dashboard".
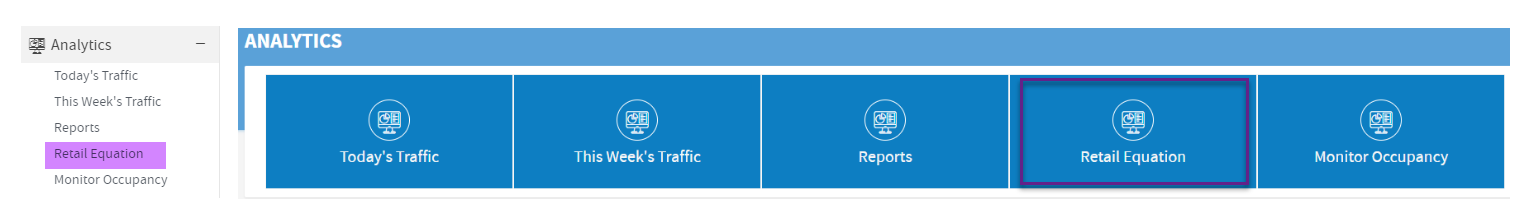
Or it can also be found under the analytics section.
Take the Tour
Once you are in the simulator, you will be greeted by the guided tour which will give you a brief overview of the different interactive elements of the Retail Equation Playground
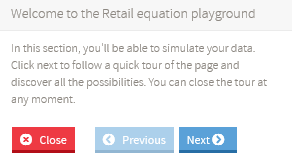
Check off "Do not show guided tour" to disable this greeting in the future. The tour can always then again be accessed by the Retake tour button.
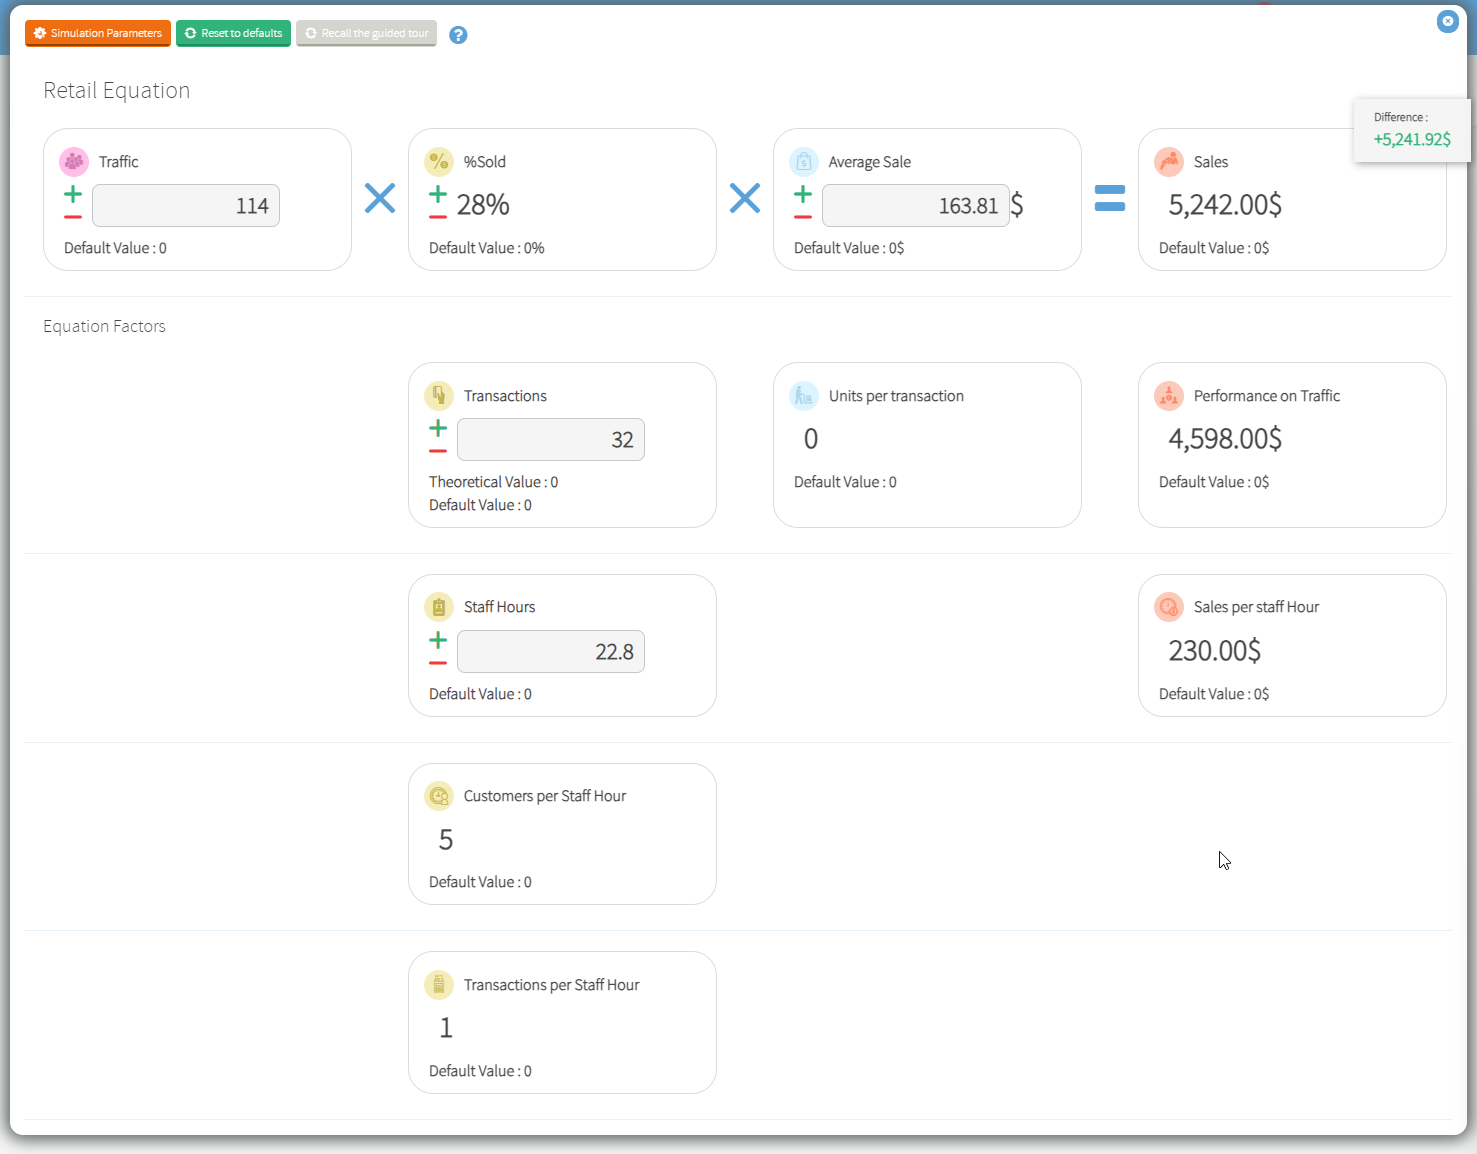
Interacting with the Simulator Tiles
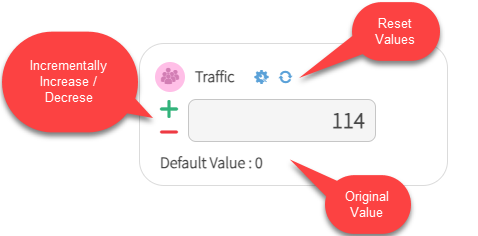
Simulation Logic
- Increases in values will have a positive influence on Sales
- Decreases in values will have a negative effect on Sales
- Manipulation of certain values will influence others
Running a simulation
- Select Simulate Equation from the Retail Equation Dashboard
- Select a location Chain / Region / Store from the location options
- Select a desired date range from the calendar selector - This will update the dashboard simulator with the value totals for that period as the default values
- Increase / Decrease or manually input desired values for Traffic, % Sold, Staff Hours, Average Sale or Transactions
- View the cascade of changes and effect on Sales Total
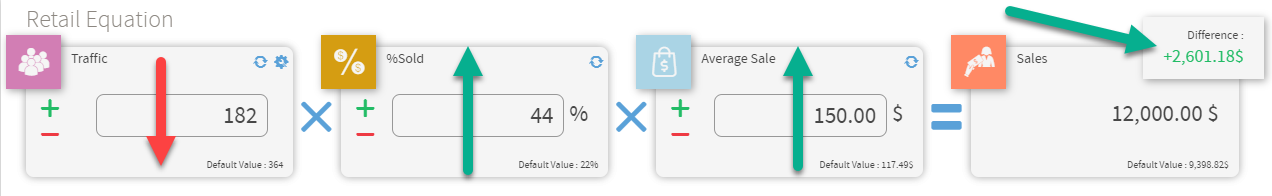
Scenarios to simulate
It is important to keep in mind that the Playground is a tool to help predict what may be, based on the new normal based on the perceived shopping behavior for a set period.
The idea is to simulate how traffic, conversion and average sale may be effected when Non-Essential retail are allowed to reopen. This will lead to a low traffic turn out in the beginning as social distancing and hygiene measures are put in place, as well as customers are still in a high state of fear to venture out to stores for purchases. However those who do venture out will have a very high intendent to purchase, especially having to wait to get into locations to shop. This means that every person who comes into the store will be an opportunity for sale. Also customers may not yet shop frequently therefore will be looking to buy more in a single visit.
- To reflect the above the following can be simulated with the Retail Equation Playground
- Pick a day/week from last year
- Decrease traffic (approximately 50%)
- Increase %Sold (doubled)
- Increase Average Sale (People may buy more, so raised by if average may include an additional item or 2 in there basket.)
- View the impact on sales difference $$$$
Note
SMS experience is that massive changes in traffic are very hard to do, and conservative approach is to work on conversion instead
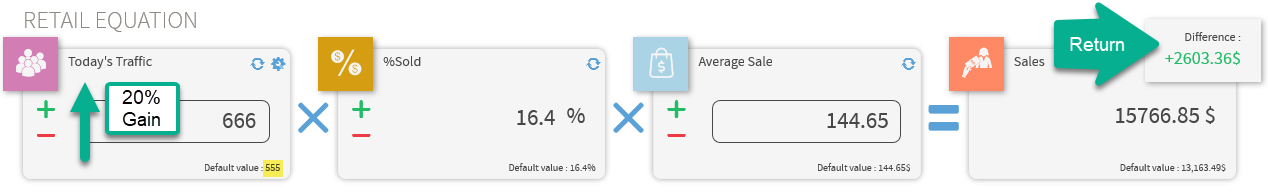
Marketing Campaign is in effect! (Beginner)
- A new marketing campaign will be going into effect and is expected to increase traffic to the store by 20%. How will this effect sales if my sales team maintains there conversion?
- Select Period for (Last Week or Last Year) which campaign will run
-
Increase traffic by 20% for period
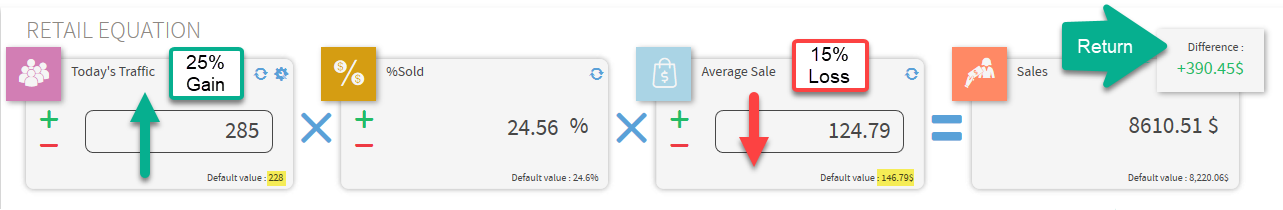
Sale is in effect! (Novice)
- A sale is in effect lowering the Average sale by 15%, this is expected to increase traffic by 25% how much more $$$ should I expect?
- Select Period for (Last Week or Last Year) where sale will be in effect
- Decrease Average Sale by 15%
-
Increase Traffic by 25%
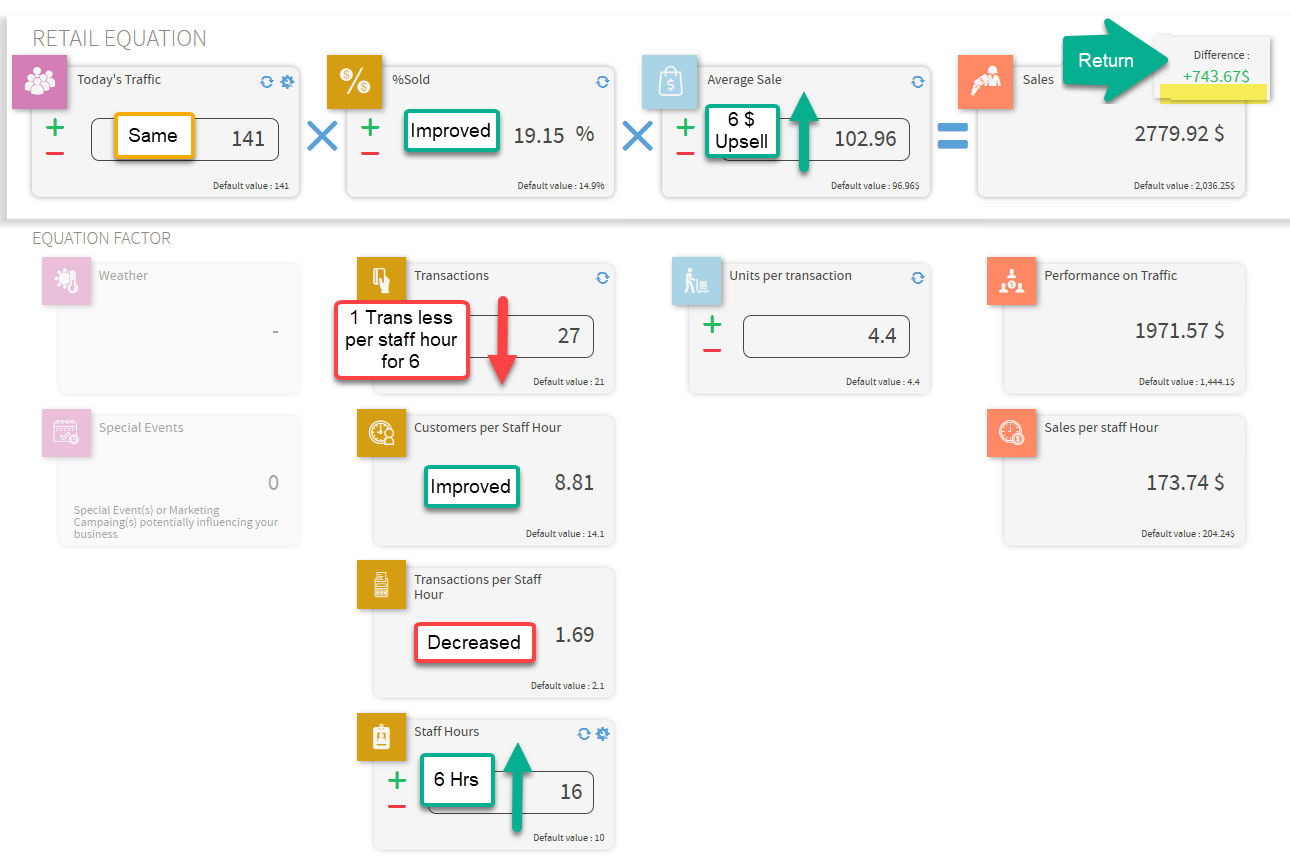
Does adding more staff help improve service? (Advanced)
Simulate the effect of adding more staff hours to serve the customers already coming into the location. Assuming that the traffic will roughly be the same, and Customer to Staff ratio is not already at its ideal, improving the service quantity (Customer to staff ratio) will lead to more sales, even though the service quality (transactions to staff ratio) dips slightly. Note: that sales will improve with more staff hours provided the cust/st ratio isn't already at its ideal and above it. Otherwise, more staff hours can mean an unproductive expense.
- Select a day for (Last Week or Last Year) where staff will be increased
- Increase Staff hours by 6 (2 more employees at 3 hours each on Saturday power hours) - This should in turn lower customer to staff ratio to desired level for improved service
- Decrease Transactions by 6 (1 less per staff hour - as they may not be as experienced) - This will lower transactions per staff ratio
- (Optional) Adjust Average sale to slightly higher as theoretically Sales staff should have a little extra time to spend with customer to upsell accessories.
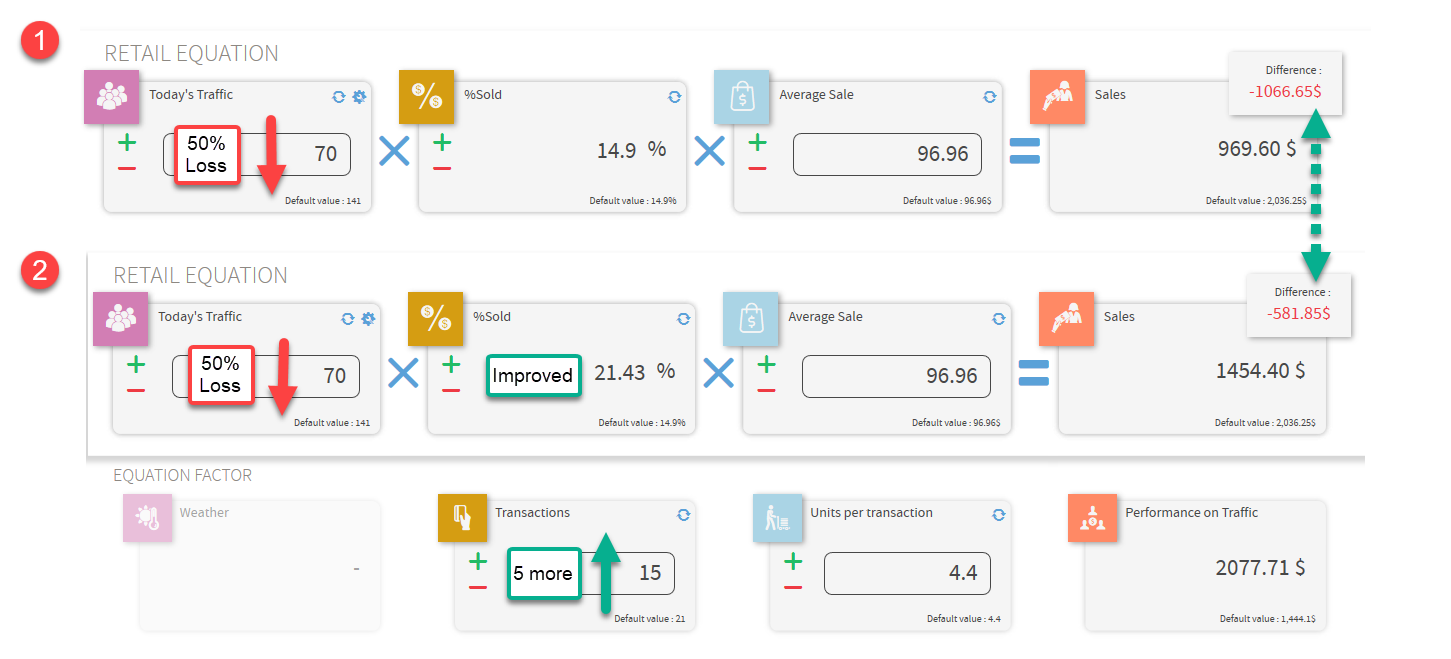
Bad Weather Forecasted - Can we do anything as it is not in our control?
A storm is coming and there will be a 50% decrease in Traffic for the day, how can I compensate for lost sales?
Mentality adjustment: Just because traffic is down, does not mean that conversion cannot go up as customer to staff ratio is improved and employees / staff can try hard to improve conversion since people have ventured out for needs. Store sets new target just 5 more transactions for the day to compensate and try to cut the loss in half.
Other questions where the R.E.P can provide insight
Q: What if I just improved our conversion by 1% chain wide or for a specific region?
A: Select the location and date range for last week or last year, then shift the Sold % up.
Q: What if we converted normally that day?
A: Pick the day and lower the conversion to your norm to find out.
Q: What if I reduce Staff hours?
A: Pick the week or day Simply lower staff hours by the shift and judge the service level.