Trafico Total
The "Go-To" Traffic-Only Report
Table of Contents
Overview:
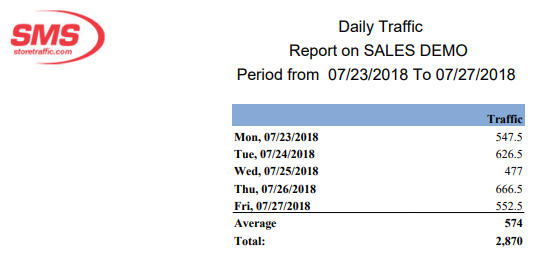
The Total traffic reports displays the traffic of the location, region or chain, at the interval selected. Unlike the Sensor Traffic Report, it does not show the breakdown per sensor but the sum of the traffic for the location.
How is it Useful?
You can aggregate data at the desired interval (15 minutes, hourly, daily, weekly, etc...) and see the traffic during the selected time range. It also allows you to track the evolution of the location's traffic at a glance.
Who would normally use this report?
Everyone, this is the "go-to" traffic only report.
Steps:
We assume that you have picked the location and date that you want to include in the reports.
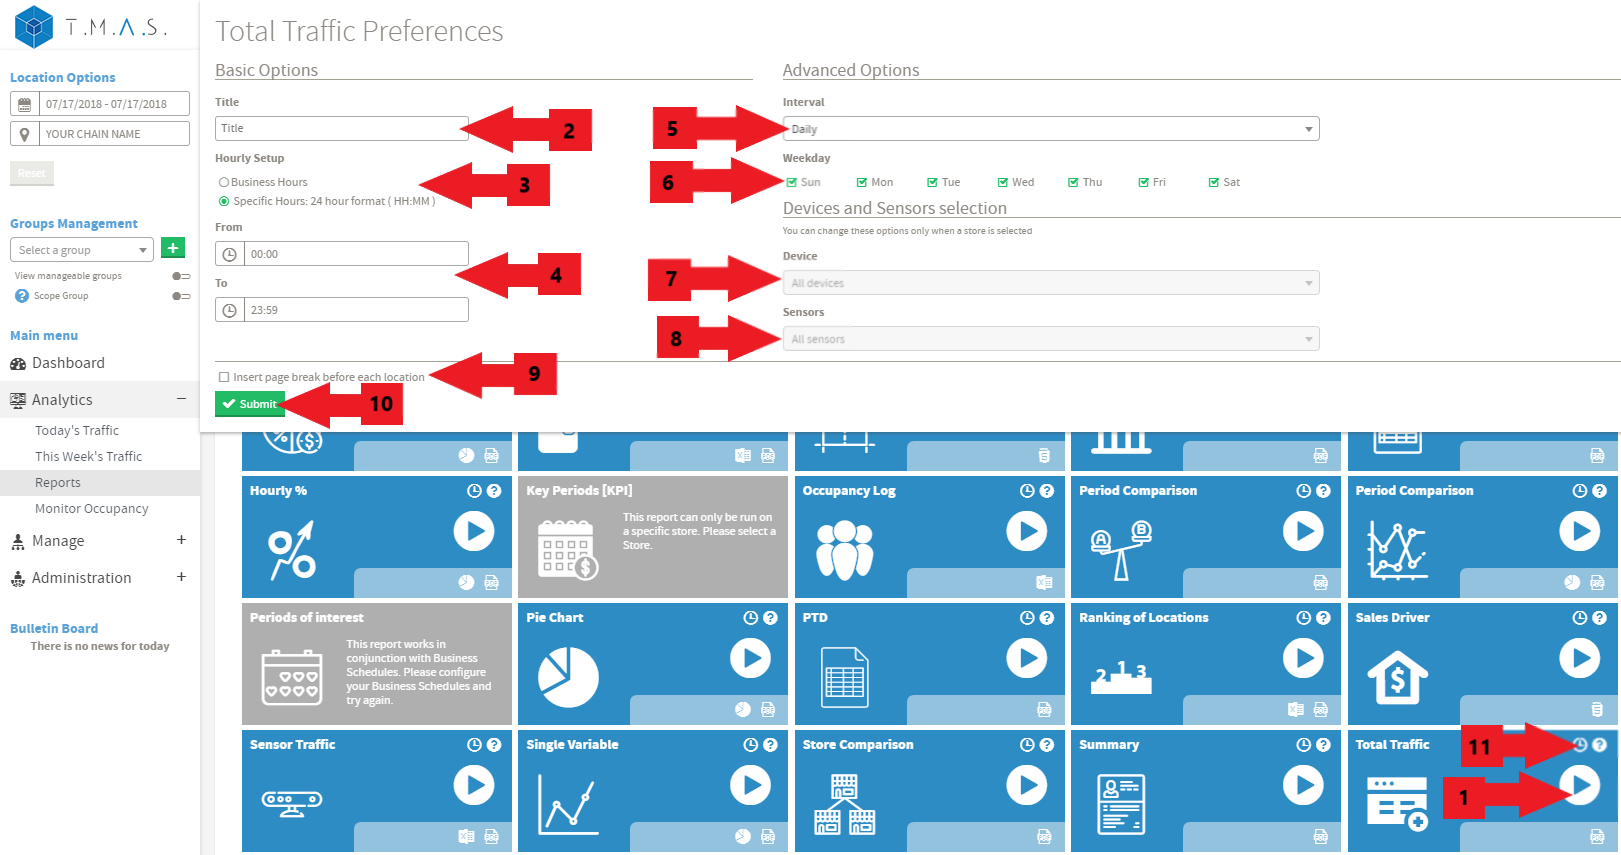
- Select the Total Traffic Report.
- Input the title name of your choice;
- Click on Business hours or Specific Hours;
- If you selected Specific Hours, Input the desired value;
- Select the desired interval;
- Select the desired days to include;
- Select the devices to include;
- Select the sensor to include;
- Select the desired options;
- Click Submit;
- Click Schedule if you wish to have it automated (See Report Scheduling for more details);
Result: