Using the Periods of Interest Report for Occupancy Tracking
Track and optimize occupancy with the Periods of Interest report. Learn how to configure business schedules, generate detailed reports, and analyze traffic patterns effectively.
Table of Contents
Overview
The Periods of Interest report measures occupancy, considering arrivals just before or after specified time blocks. It provides minimum, maximum, and average occupancy in a weekly schedule format, allowing you to filter traffic data by time blocks throughout the day.
Importance
This report helps track occupancy and traffic as per business schedules, making it useful for various institutions like churches, fitness centers, museums, libraries, educational institutions, and business conferences.
Use Cases
- Churches: Track peak occupancy during services to manage crowd control and ensure safety measures.
- Fitness Centers: Monitor occupancy during different time blocks to optimize staff scheduling and enhance member experience.
- Educational Institutions: Analyze traffic patterns during class hours to allocate resources effectively and improve campus safety.
Warning
For Min, Max and Average occupancy to be accurate data points, the unit(s) must be communicating in Real-Time, what is only possible with Real-Time subscriptions. Please contact success@storetraffic.com to learn more about this option for you.
Report Example

Who would normally use this report?
|
Churches |
|
|
Fitness Centers |
|
|
Museums |
|
|
Libraries |
|
|
Educational Institutions |
|
|
Business Conferences |
|
Meeting Rooms |
|
Community |
|
Accessing the Periods of Interest Report
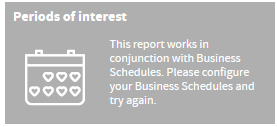
- This report is ONLY available if Business Schedules have been configured, scroll down to the configure the business schedules section for more information.
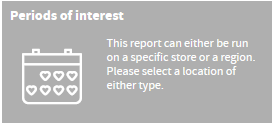
- Also this report can ONLY be run on a single location at a time, verify location selection.
Configuring Business Schedules
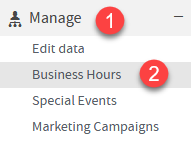
- Select Manage
-
Select Business Hours
-
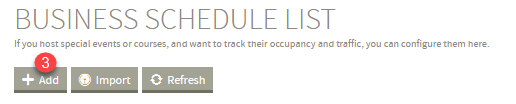
Click Add under the Business Schedule List
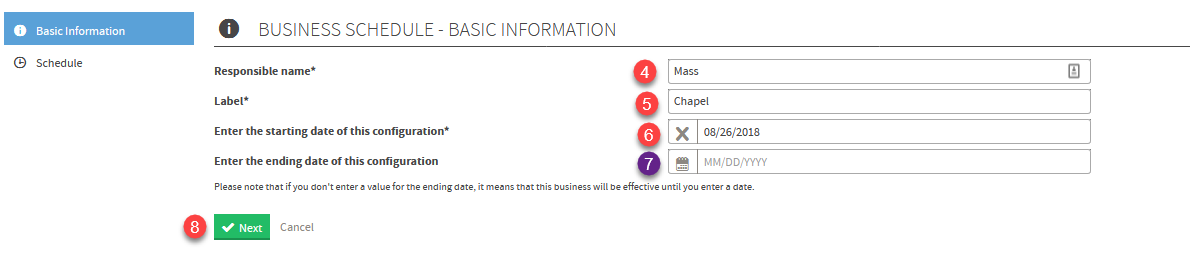
- Input Responsible Name for this schedule (Example: Name of Instructor or Name of Event)
- Input Room Label
- Select Starting Date
- (Optional) Select Ending Date if applicable, leave blank if NO END DATE
-
Click Next
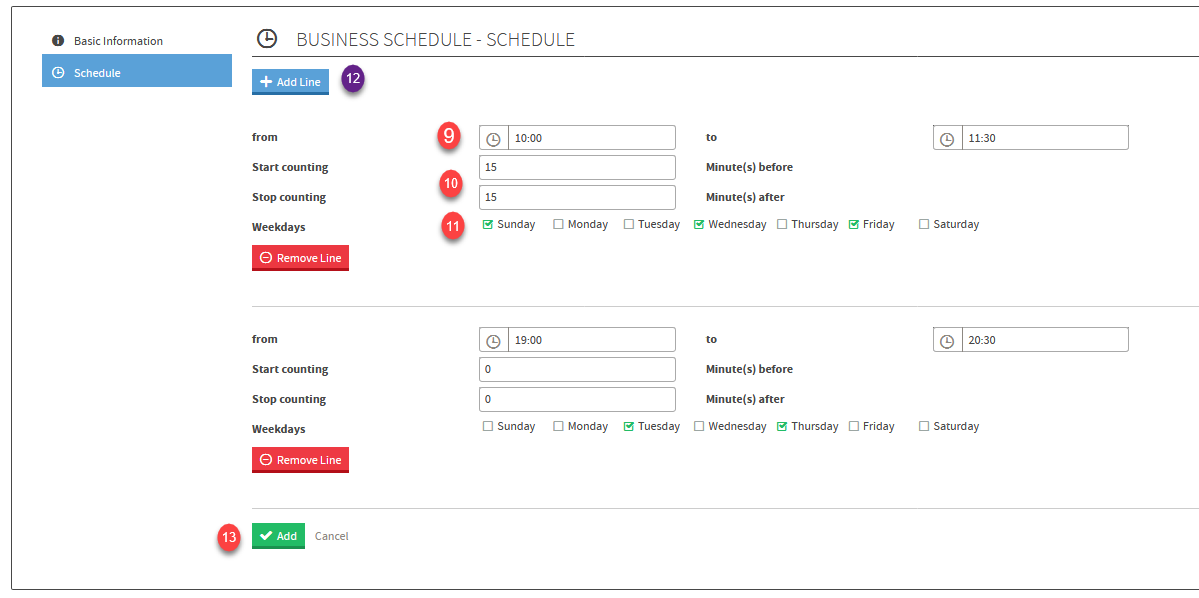
- Indicate the From and To time of the Event
- Input the Start counting minutes before or End counting minutes after.
- Checkoff the Days of the week that this Event occurs in the exact same time
- (optional) Select Add Line if this Event occurs in different time block, then repeat steps 6-11 for the new line
-
Click Add to save configuration
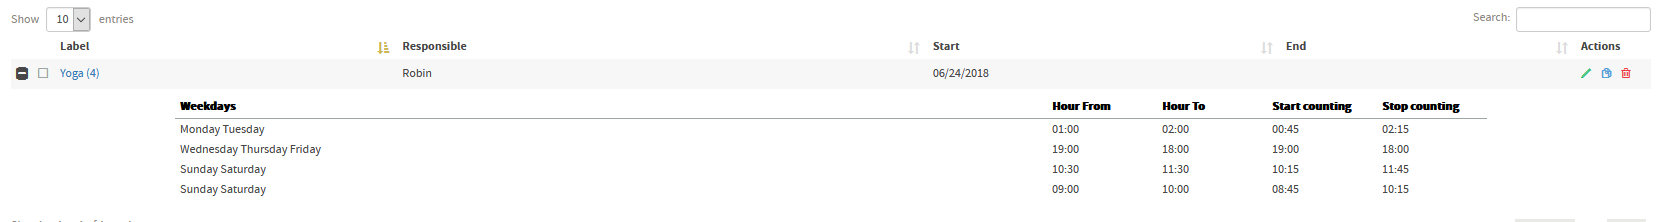
Business Schedule will now appear as follows
Steps to run a Period of Interest Report
-
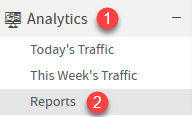
Select Analytics
- Select Reports
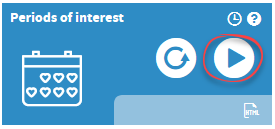
- Click the Play Icon on the Period of Interest report to generate the report
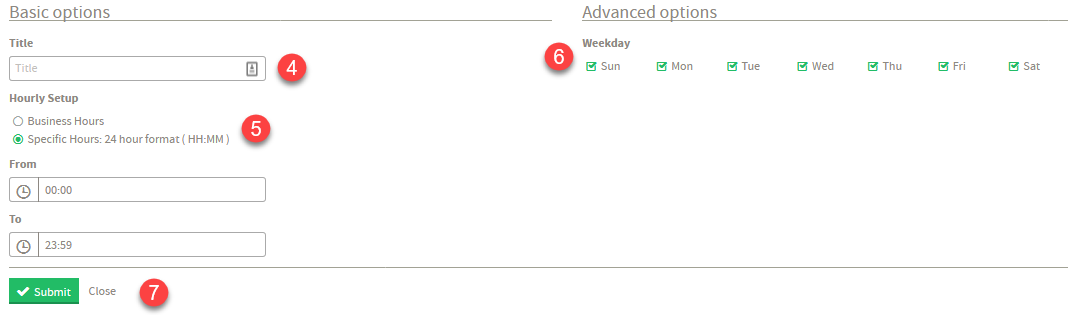
- (Optional) Input a title for the report
- Bullet business hours or specify specific hours
- Select desired weekdays to display
-
Click Submit
*Note - This report can be scheduled - Refer to the scheduling a report help article about how to successfully schedule reports.
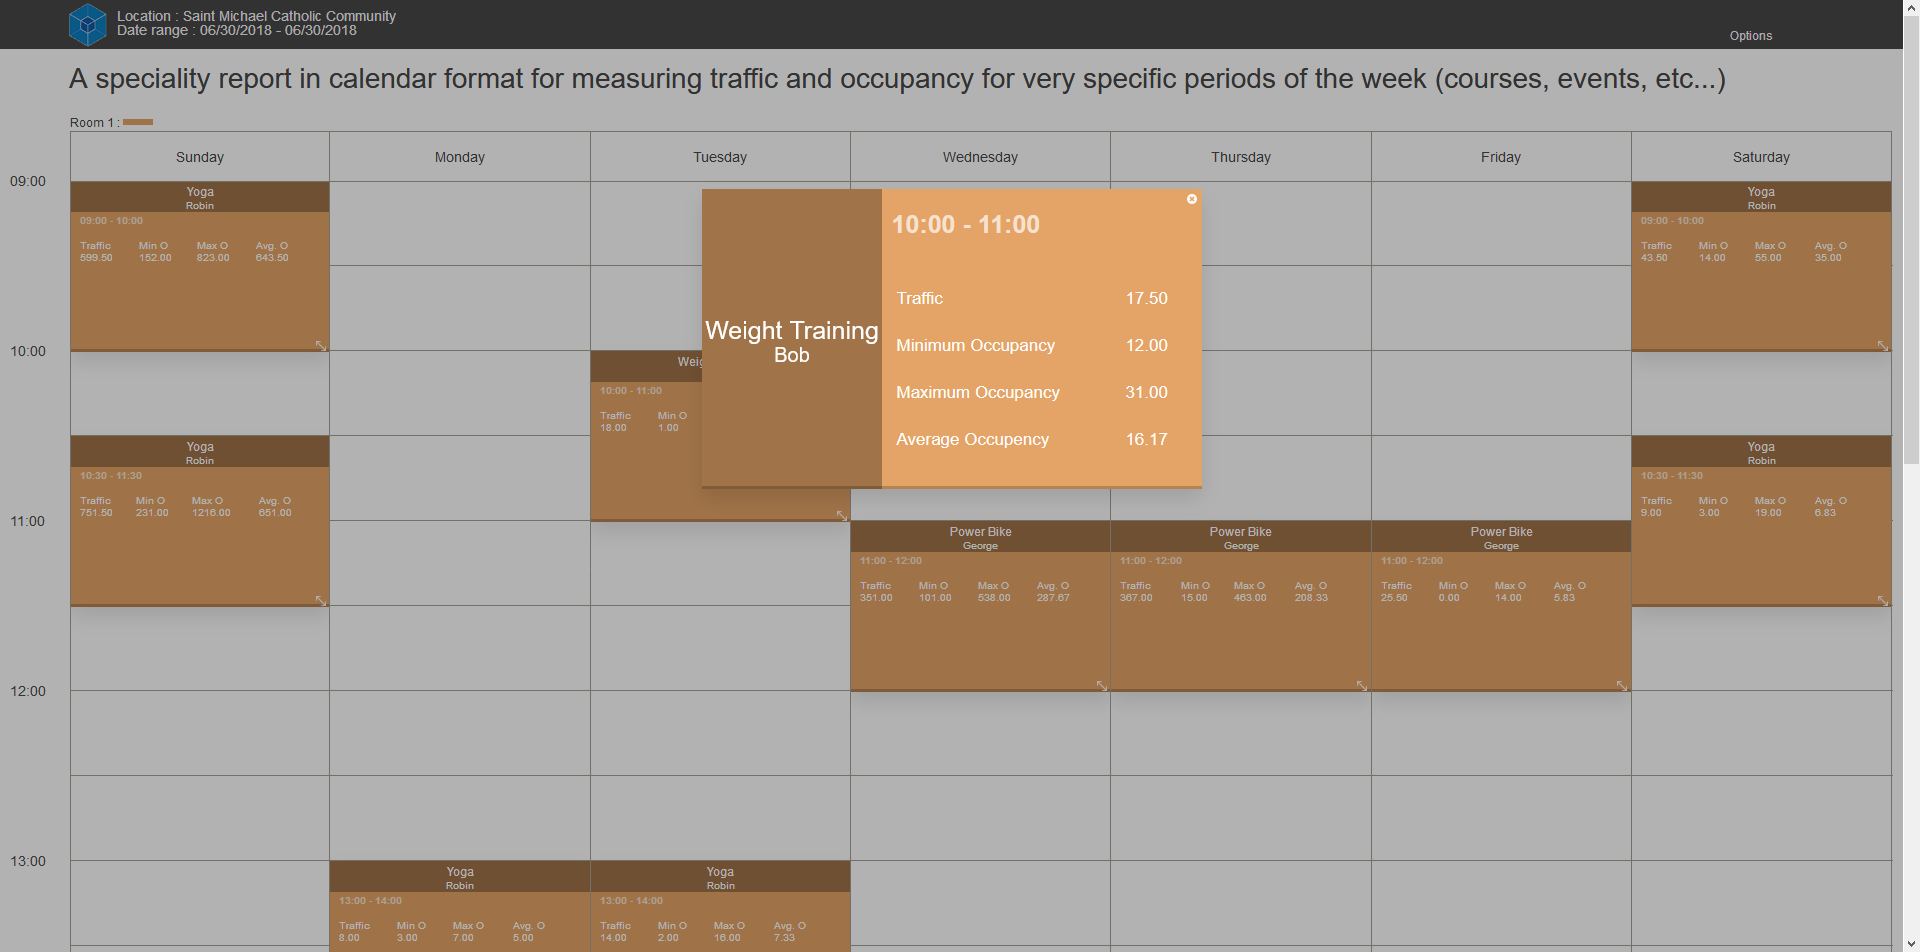
Interacting with the Report
Expand each period block to have a closer look at the traffic / occupancy data.
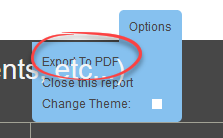
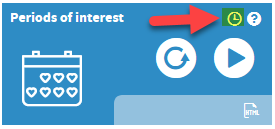
Change Theme in options for easier reading at night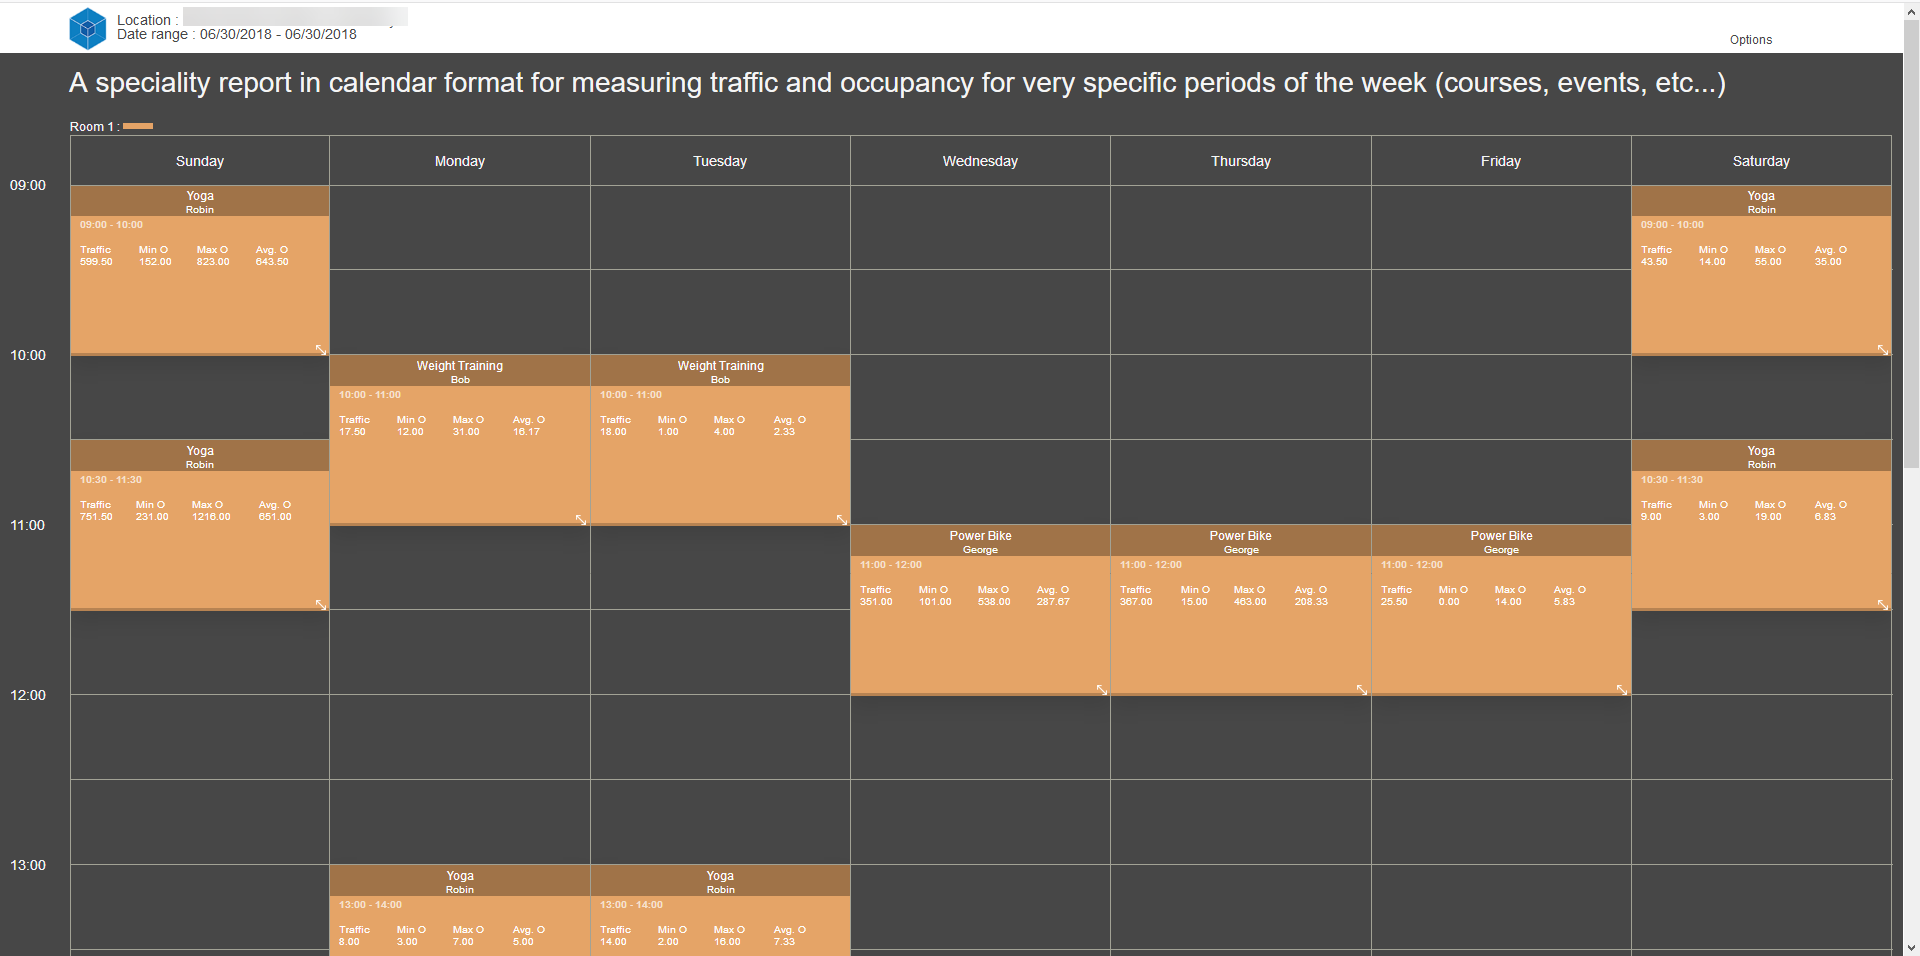
Export the report to PDF - from within the Report under options (Top Right)