Optimize Sales with Key Periods KPI Report
Discover how to optimize store performance by identifying peak sales times with the Key Periods KPI Report. Adjust staffing to enhance customer service and maximize sales.
Table of Contents
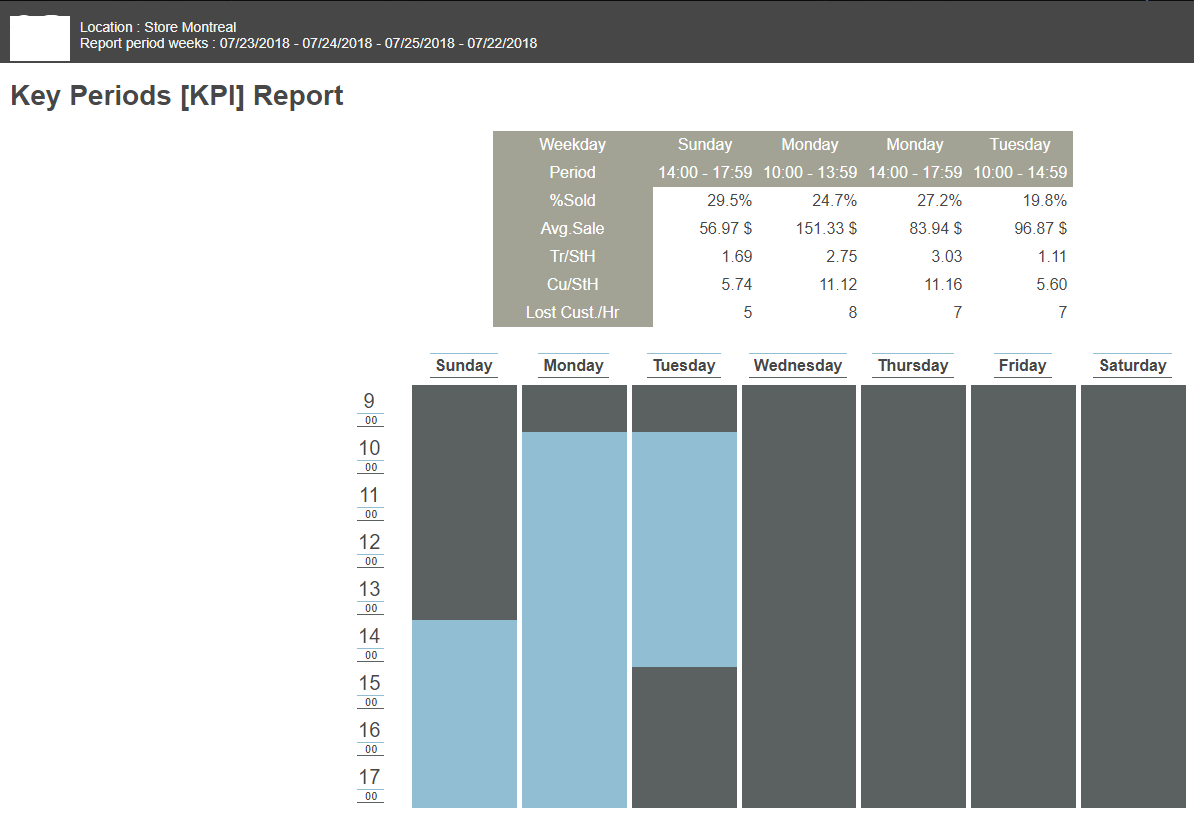
For Retailers - Discover your 4 most important periods in a week
The Key Period Indicator (KPI) tool identifies the four most critical periods in a week when staff should focus on selling, as these are the times with the highest buying traffic. By analyzing four weeks of data, the software pinpoints these key periods, enabling stores to optimize service and boost sales.
Benefits
Understanding your store’s key periods allows you to adjust staffing and service levels to maximize sales. Running this report quarterly using representative weeks ensures you can plan effectively, mobilizing all staff during high-impact times to enhance customer service and drive sales.
Use cases for the Key Periods KPI Report:
- Optimizing Staffing Levels: Store managers can use the report to schedule staff during peak buying times, ensuring adequate coverage and improved customer service.
- Enhancing Sales Strategies: Retailers can focus marketing efforts and in-store promotions during the identified key periods to maximize sales and customer engagement.
- Performance Evaluation: Business leaders can use the report to assess the effectiveness of staffing and promotional strategies during key periods, making data-driven decisions for future improvements.
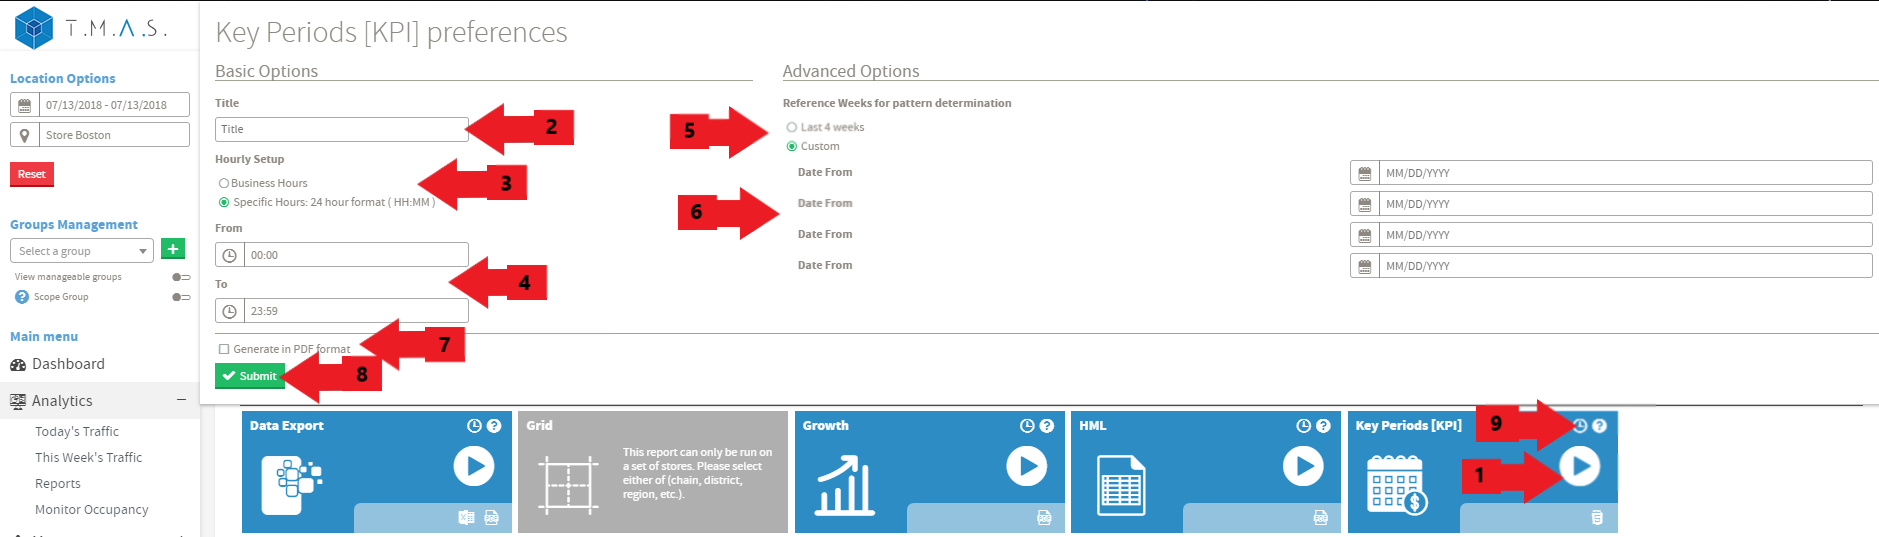
How to generate it
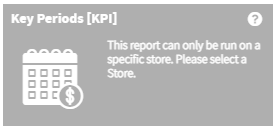
This report can only be run on a specific store and cannot be run on a Chain, District, Region or group of stores as the tile will be greyed out.
- Select the Key Periods KPI Report.
- Enter your desired title.
- Choose either Business Hours or Specific Hours.
- If Specific Hours is selected, input the desired hours.
- Choose between Last 4 weeks or Custom patterns.
- If Custom is selected, specify the dates.
- Select the required options.
- Click Submit.
- Click Schedule for automated reporting (see Report Scheduling for details).