Weekly Performance Report
For Retailers - A Weekly View on your Perfomance with Graphs and Comparative
Table of Contents
Overview
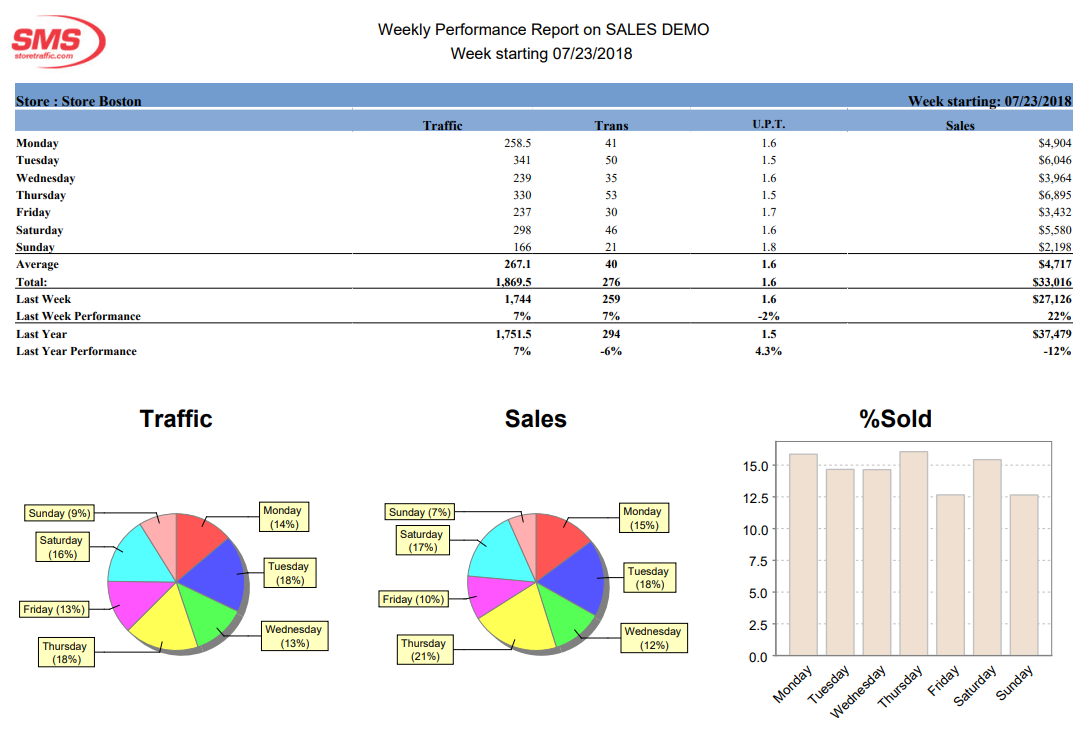
The Weekly Performance report allows you to evaluate the performance of a week on different dimensions. You have the summary of your performance per day, with graphics, but also comparative numbers with the same week last year and with the last week.
How is it Useful?
It is an ideal report to run at the beginning of week to review the past week performance. It offers a very detailed overview of your actual performance and a quick comparison to see if you are improving vs LW and LWLY (last week, last year).
Who would normally use this report?
The store manager and any other member of the organization, who are interested in getting an idea of the progress over time.
Steps:
We assume that you have picked the location and date that you want to include in the reports.
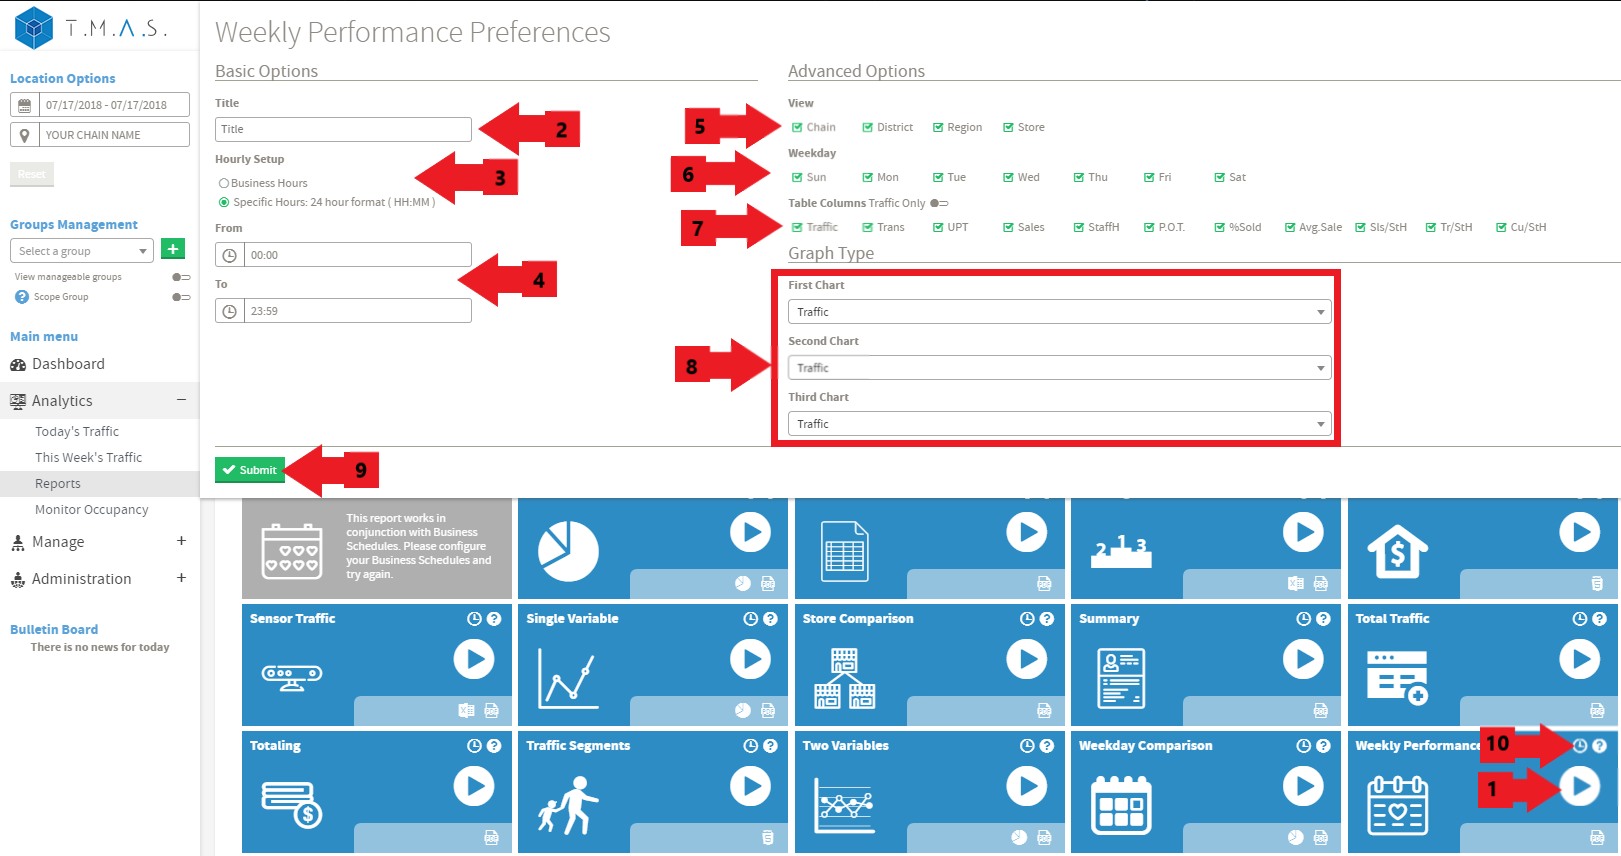
- Select the Sensor Traffic Report.
- Input the title name of your choice, this is optional;
- Click on Business hours or Specific Hours;
- If you selected Specific Hours, Input the desired value;
- Select the desired view;
- Select the desired days to include;
- Select the desired columns to include;
- Select the three variable on which you want to report;
- Click Submit;
-
Click Schedule if you wish to have it automated (See Report Scheduling for more details);
Result: