Maximize Store Performance with SMS Storetraffic's Grid Report
Use SMS Storetraffic's Grid Report to analyze store productivity and service levels. Generate detailed reports for multiple stores and schedule them for automated insights.
Table of Contents
Retailers: Tail-Management with a Performance on Traffic perspective
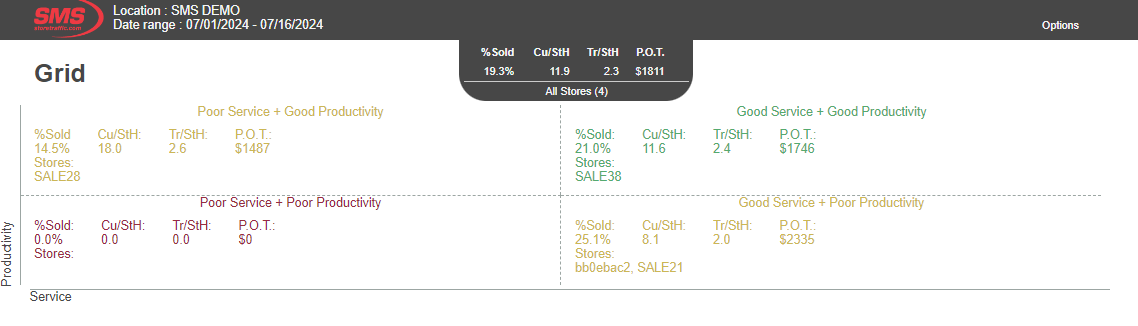
The Grid Report is an analytical tool used to classify stores into four distinct groups based on productivity and service levels. The groups are:
1. Good Service, Good Productivity (GSGP)
2. Good Service, Poor Productivity (GSPP)
3. Poor Service, Good Productivity (PSGP)
4. Poor Service, Poor Productivity (PSPP)
This categorization helps district or head office managers identify areas requiring improvement. By analyzing these groups, you can better understand which stores are performing well and which need attention.
We suggest you compare the same type of stores (factory, strip mall, stands alone, etc.) since each store type would have different trend of data and various customer types. You are going to get better and more precise reports analyzing that way.
Example Report Result
Using the Grid Report, managers can make data-driven decisions to enhance overall store performance.
Use Cases
- Identifying High-Performing Stores: A district manager uses the Grid Report to identify stores with high productivity and good service levels (GSGP). By analyzing these stores, the manager can understand best practices and implement similar strategies across other stores in the region to enhance overall performance.
- Targeting Improvement Areas: A head office analyst runs the Grid Report to pinpoint stores falling into the Poor Service, Poor Productivity (PSPP) category. The analyst then develops targeted action plans, such as additional training or resource allocation, to address specific deficiencies and improve store performance.
- Scheduling Automated Reports: A regional manager schedules the Grid Report to run monthly, providing automated insights into store performance. This allows for continuous monitoring and timely intervention, ensuring that performance issues are identified and addressed promptly, leading to sustained improvements and better decision-making.
Steps to Generate the Grid Report
1. Select Location and Date/Time:
- Choose the specific locations and the date/time range you want to analyze.
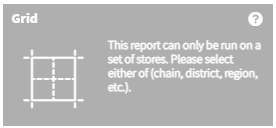
Note
The report needs to be run on a Chain, District, Region, or a Group of Stores. If only a single store is selected, the report option will be greyed out.
2. Choose Business Hours:
- Define whether to use business hours or specific hours for the report.
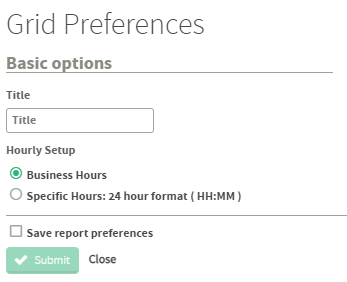
3. Select Submit