HML Report
Unlocking Sales Insights: HML Analysis Reporting for Retail Success
Table of Contents
Overview
HML analysis, also known as High-Medium-Low analysis, is a method used in retail to categorize products or items based on their sales performance. It involves dividing items into three groups: high performers, medium performers, and low performers. However, it can also be applied to employee scheduling to optimize staffing levels and improve operational efficiency.
The purpose of HML analysis is to gain insights into the performance or value of items or factors and make informed decisions based on their categorization. It helps identify areas of strength, focus on improvement opportunities, allocate resources effectively, and optimize decision-making in various contexts such as sales, inventory management, and employee scheduling.
The HML report calculates weekly High, Medium and Low days of activity in the store based on the one of the following variables: POT, Sales, Traffic, %Sold, Average sale, Customer per staff hour and Transaction per staff hour.
The HML report automation analyzes 4 weeks of data and returns in a PDF report different indications:
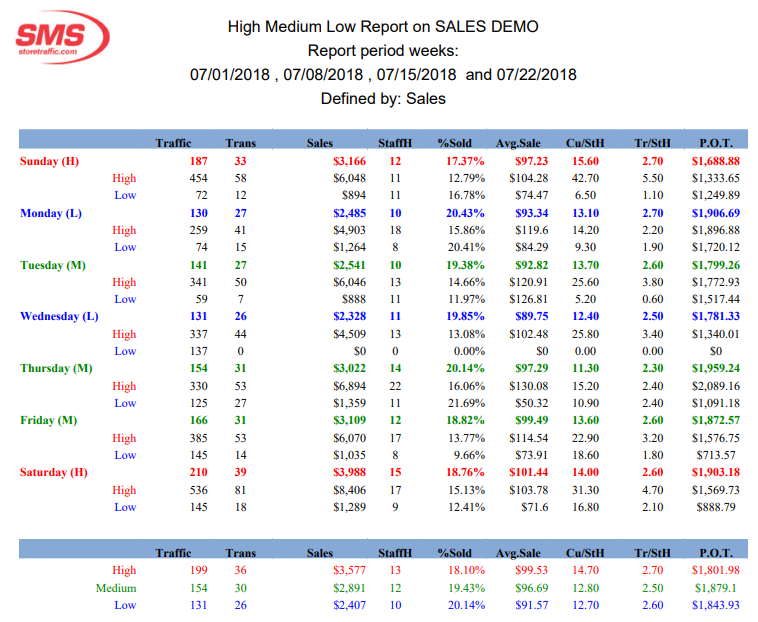
- The report will identify by a written H, M, or L, which weekday is a high, medium or low contributor for the selected variable.
- The report will then indicate, for everyday, what was the performance of the Highest day, and the performance of the lowest day in the 4 weeks selected.
- At the bottom of the page, the report will summarize the typical performance for each category of day, indicating what to expect for High, Medium an Low days.
Example:
How is it Useful?
HML analysis can help with employee scheduling in retail:
- Identify high, medium, and low sales periods: By analyzing historical sales data, you can identify the periods of high, medium, and low sales activity in your retail store. This could be daily, weekly, monthly, or even seasonal patterns.
- Allocate more staff during high sales periods: During high sales periods, you can schedule more employees to ensure sufficient coverage. This helps prevent understaffing, which can result in long customer wait times, poor service, and missed sales opportunities.
- Adjust staffing during medium sales periods: Medium sales periods may not require the same level of staffing as peak hours but still require adequate coverage. You can schedule a moderate number of employees to meet customer needs without overstaffing, thus optimizing labor costs.
- Optimize staffing during low sales periods: During low sales periods, you can reduce the number of scheduled employees without compromising customer service. By efficiently managing staffing levels during slower periods, you can control labor costs and avoid unnecessary expenses.
- Consider employee skills and availability: When creating schedules, take into account the skills and availability of your employees. Ensure that employees with specific expertise or training are scheduled during appropriate times when their skills are most needed.
By utilizing HML analysis and aligning employee scheduling with sales patterns, you can optimize staffing levels, enhance customer service, reduce labor costs, and improve overall operational efficiency in your retail store. It's important to regularly review and adjust schedules based on changing sales trends and employee performance.
Who would normally use this report?
In a retail organization, the responsibility for performing an HML analysis may fall under the purview of different individuals or departments, depending on the size and structure of the organization. Here are a few possible roles that could be involved in conducting an HML analysis for a retail store:
- Store Manager: The store manager plays a crucial role in monitoring and analyzing the store's performance. They may be involved in conducting or overseeing the HML analysis to identify sales patterns and determine appropriate employee scheduling strategies to meet customer demand effectively.
- Sales or Operations Manager: The sales or operations manager oversees the overall sales and operational performance of the retail store(s). They may collaborate with other departments to conduct an HML analysis and use the findings to optimize employee scheduling, staffing levels, and customer service strategies.
- Data Analyst or Business Intelligence Team: In larger retail organizations, there may be dedicated data analysts or business intelligence teams responsible for analyzing sales data and providing insights to various departments. They may utilize advanced analytical tools and techniques to perform an HML analysis and present actionable recommendations to optimize employee scheduling and other aspects of store operations.
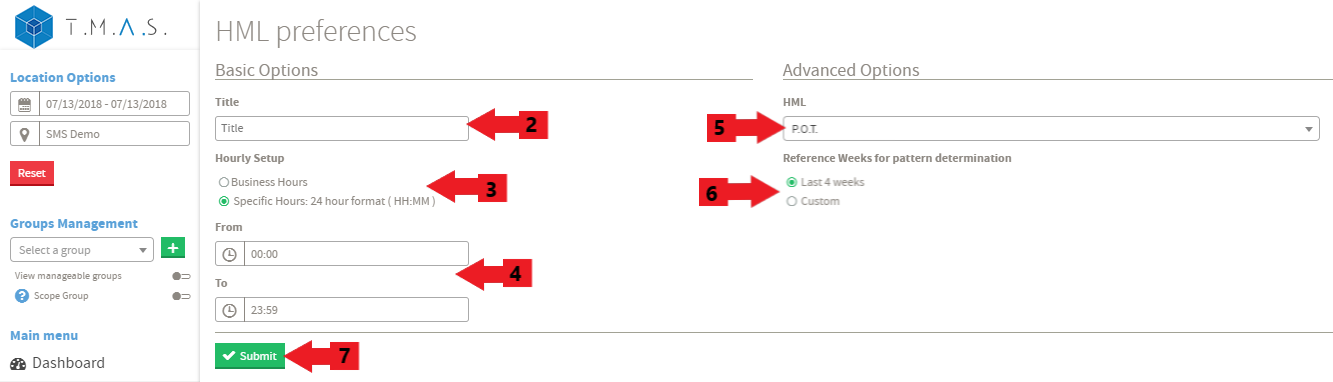
Steps:
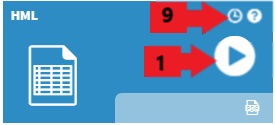 |
 |
|
|
We will assume that you have picked the location and date that you want to include in the reports.
|
FAQ
| Q: Are there any limitations to HML analysis? |
| A: HML analysis provides a simplified categorization of items, which may overlook nuances and variations within each group. It relies heavily on the chosen criteria, and different criteria may yield different results. HML analysis should be used as a tool to guide decision-making, but it should be complemented with additional analysis and contextual understanding. |
| Q: How frequently should HML analysis be performed? |
| A: The frequency of conducting HML analysis depends on the nature of the data and the purpose of the analysis. It can be done periodically, such as monthly or quarterly, to identify trends and make informed decisions accordingly. However, the frequency may vary based on the specific needs of the business or industry. For the purpose of scheduling, it should be conducted prior to setting a schedule to determine if trends have changed. |