Totaling Report
Retailers - The "Go-to" and simple report, in PDF.
Table of Contents
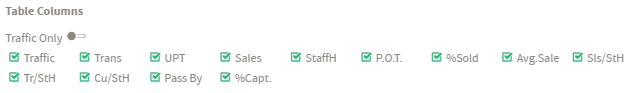
The Totaling report is usually the first report used by retailers that also import their sales & staff information. It is a grid type report in PDF, which can easily be printed. You can select which variables you would like to include (traffic, sales, %sold, etc...)
How is it Useful?
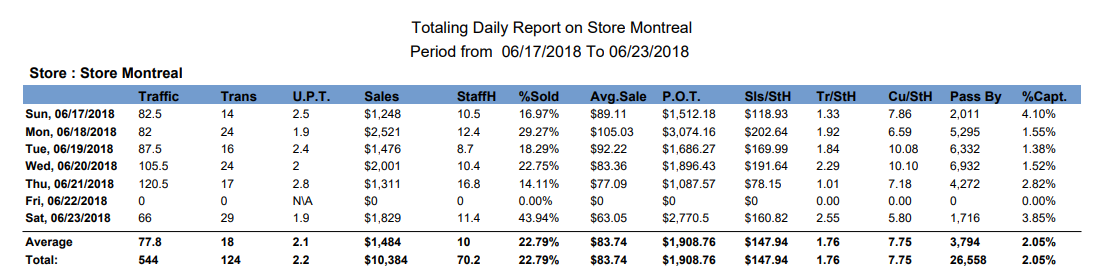
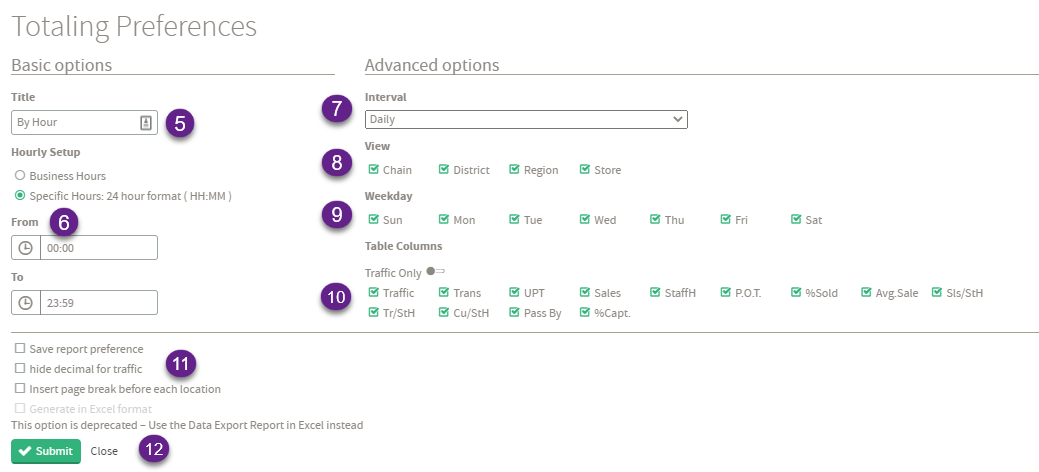
You can aggregate data at the desired interval (15 minutes, hourly, daily, weekly, etc...) and see how you have performed during those periods. It also allows you to track the evolution of the location's performance at a glance. Anyone who wants to manipulate the data in Excel should use the Data Export Report.
Who would normally use this report?
Everyone in the organization that wants an answer to "how did we perform during [period]".
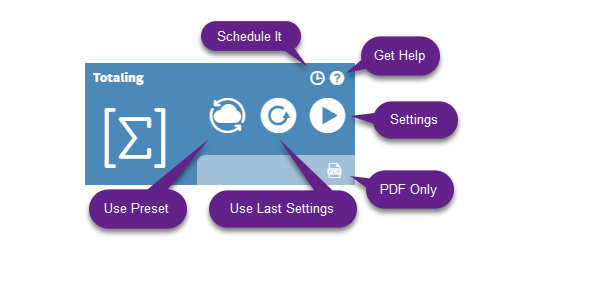
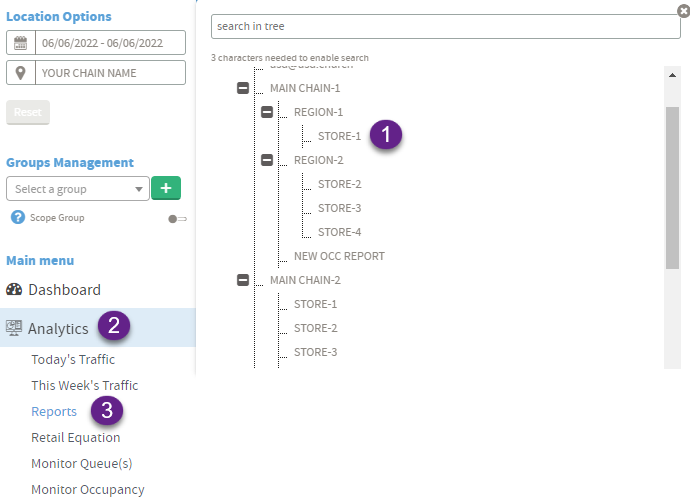
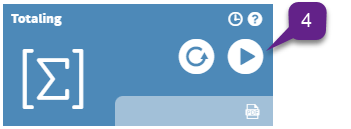
How to generate a Totaling Report?
|
|