Optimizing Traffic with the Hourly% Report
Learn how to use the Hourly% Report to analyze hourly traffic trends, identify peak periods, and optimize business hours. This guide provides step-by-step instructions for generating and scheduling your report.
Table of Contents
Overview:
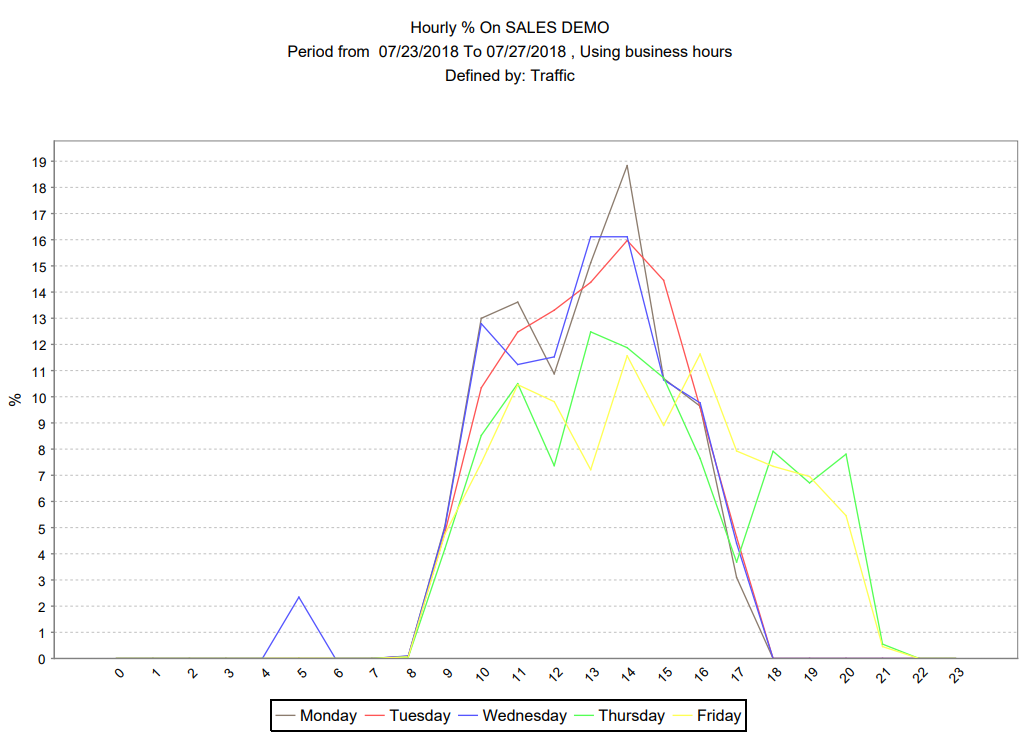
The Hourly Percentage graph is used to compare the hourly traffic distribution for each day of a specified time period.
How is it Useful?
It is an extremely useful reports to understand the typical daily and weekly traffic trend. With a glimpse, you can identify your busiest weekly periods.
Who would normally use this report?
Everyone
Steps:
We assume that you have picked the location and date that you want to include in the reports.
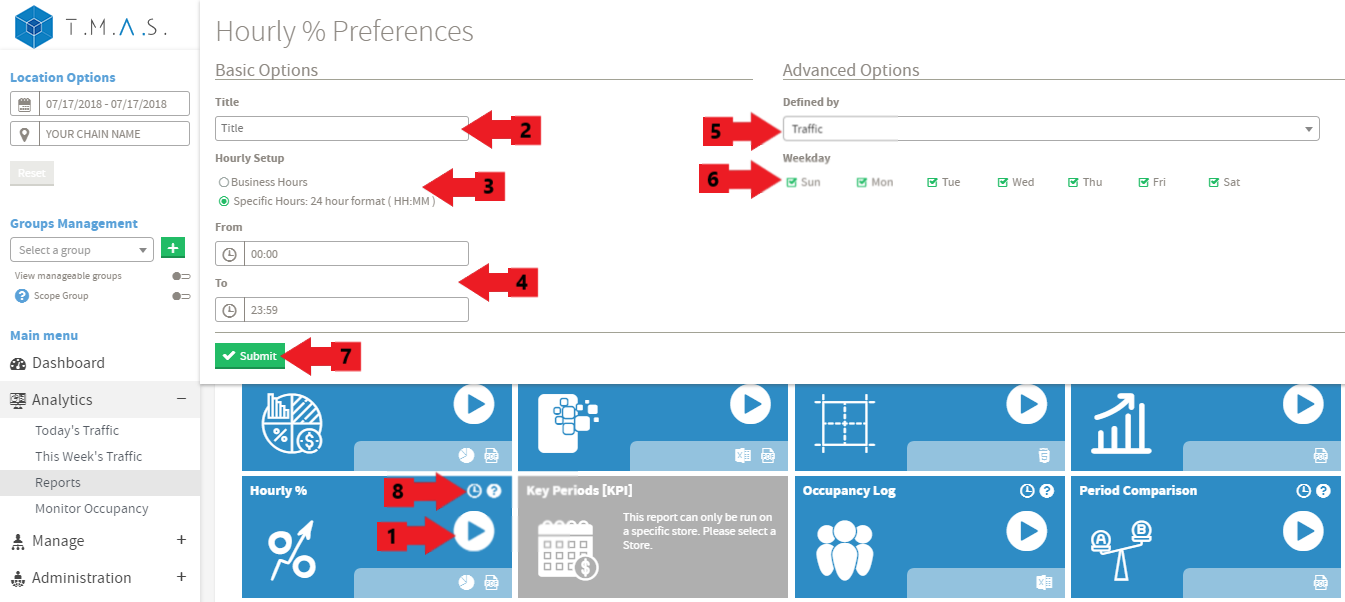
- Select the Hourly% Report.
- Input the title name of your choice, this is optional;
- Click on Business hours or Specific Hours;
- If you selected Specific Hours, Input the desired value;
- Select the “Defined by” drop-down and select the desired variable to include;
- Click on the desired days to include;
- Click Submit;
-
Click Schedule if you wish to have it automated (See Report Scheduling for more details);
Result: