Today's Dashboard
Valuable data at a glance
Table of Contents
Overview
The dashboard gives you valuable data at a glance. Default setting provides data for the current date & time and based on the current location selected. Each tile represents a different data variable which can be displayed based on the information that has been provided to T.M.A.S. through POS Integrations or importing files.
Retail Equation
The Retail Equation displays dashboard tiles in the order to understand influencing factors of sales.
Learn about Retail Equation Playground

(New) Editing Sales and Transactions on the Retail Equation Dashboard
When targeting a specfic location
Note
Requires a Retail Subscription Plan
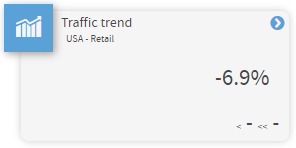
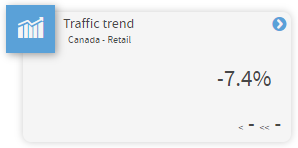
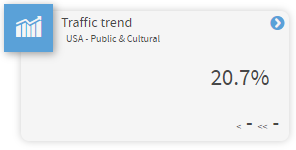
Industry Index
A tool for organizations to see traffic-specific benchmarks and trends related to their industry and country of origin.
 |
 |
 |
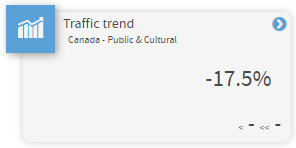 |
Traffic Trend tile will provide a week-to-date (Sunday to Saturday) percentage-based stat indicating if traffic is UP+ or DOWN- as a sum of all businesses dependent on the country or the location's industry (Retail or Public & Cultural). The trend compares Last week to date to This week to date (Sunday to Saturday).
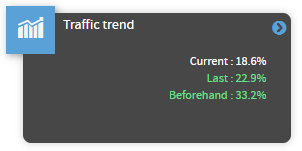
Hovering over tiles will provide stats for the previous week and the week beforehand.
Dashboard Traffic Only Tile Filtering

Depending on the Chain / Region / District or Location's business category selection, the dashboard will display Sales and Staff data along with Traffic data or simply Traffic only.

Sales and Staff Data Displayed |
Traffic Only Tiles Displayed |
||
|
Arts, crafts, and collectibles
Babies
Beauty and fragrances
Books and magazines
Clothing, accessories
Computers, accessories, and services
Electronics and telecom
Food retail and service
Gifts and flowers
|
Health and personal care
Home and garden
Pets and animals
Retail (not elsewhere classified)
Sports and outdoors
Toys and hobbies
Travel
Vehicle sales
Vehicle service and accessories
|
Business to business
Education
Entertainment and media
FIN("Financial services and products")
Government
Nonprofit
|
Religion and spirituality (for profit)
Services - other
Malls and diverse shopping centers
Public Institutes and Organisms
Unclassified/Not_Specified
|
User Role-Based Dashboards
Depending on the role membership indicated on a user account, one of the following dashboards will appear as default, in addition to the Retail Equation.
Customization of Dashboards available on demand
- Limited to hiding unwanted tiles for focus purposes.
- Please note additional $fees may apply.
- Please send requests/inquiries to techsupport@storetraffic.com for more information.

Traffic Dashboard Tiles
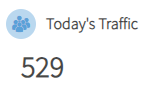 |
Today's Traffic - Current Traffic up to the last update from the Traffic counter |
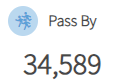 |
Pass By - Traffic that has passed in front of your location |
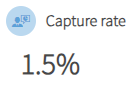 |
Capture Rate - Ratio between trafficdollar passing in front of your location and Walk-in traffic (traffic entering into the location) |
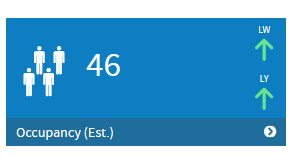 |
Occupancy - Estimated number of people currently inside the location (available with directional traffic counting technology only) |
Sales Dashboard Tiles
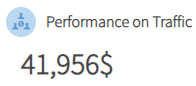 |
Performance on Traffic - Current sales dollar value per 100 people walking in, based on the current general performance |
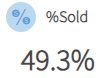 |
% Sold - Transactions / Traffic (Conversion Rate) |
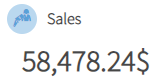 |
Sales - Total sales dollars accumulated for Today |
 |
Average Sale - Sales Dollars averaged to a single transaction for Today |
 |
Transactions - Total accumulated transactions for Today |
 |
Units per Transaction - Average number of items purchased per transaction for Today |
Staffing Dashboard Tiles
 |
Staff Hours - Total of the accumulated staff hours for today |
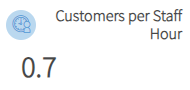 |
Customer per staff Hour - Traffic 'handled' for each single staff hour |
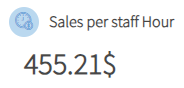 |
Sales per staff Hour - Sales currency 'handled' for each single staff hour |
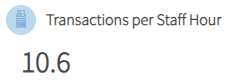 |
Transactions per staff Hour - Average number of transactions 'handled' for each single staff hour |
Facts Dashboard Tiles
 |
Weather - Current weather in the the selected location Data source: openweathermap.org - Refresh rate: about every 3 hours |
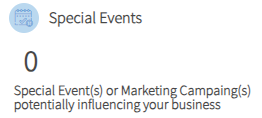 |
Special Event / Marketing Campaign - Displays indicator if there are any current or past events for the selected location |
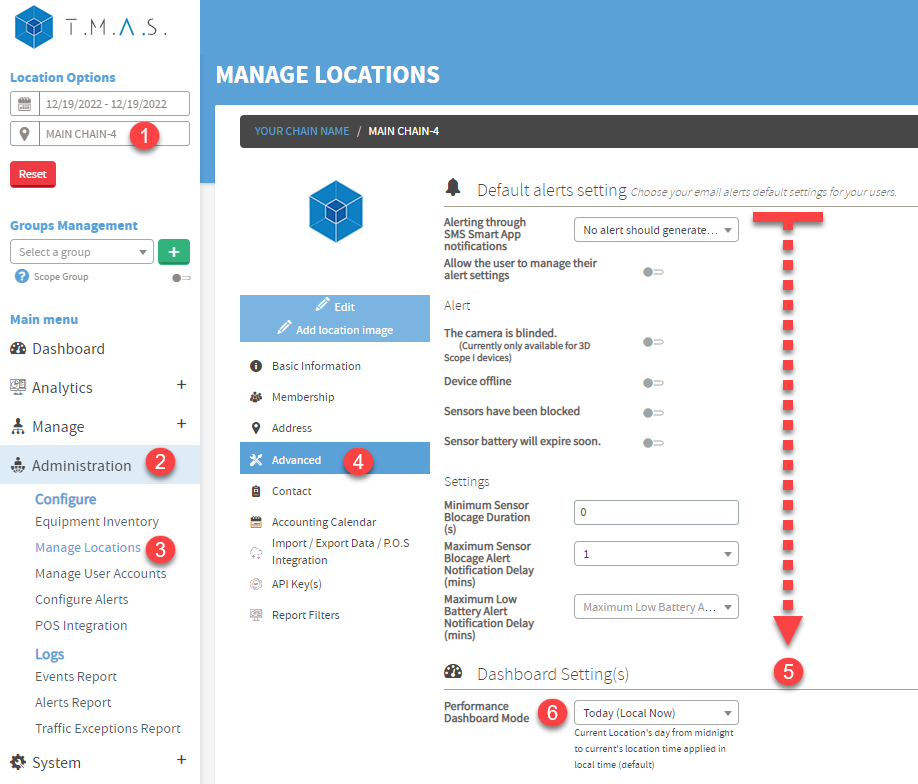
Dashboard Setting(s)
The performance dashboard mode can be configured to display data based on the Chain / Region's location as well as consider the business hours of locations.
| How to change the performance dashboard mode | |
 |
|
F.A.Q.
|
Q: Where can I change my industry for the Industry Index? 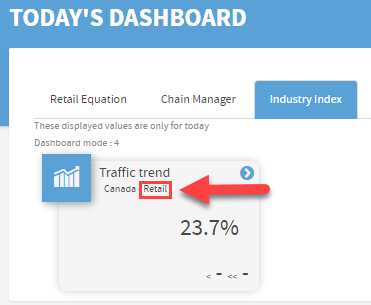 |
| A: You can modify your Business Category for your chain with the option found in Manage locations under basic information. |