PTD - Performance to date report
Retailers - A quick look on your performance for the current day
Table of Contents
Overview
Used by the store managers, the Performance to Date report is beneficial as it provides a quick look at the current day’s data compared with the average during the previous four weeks of the same period. This is considered a legacy report as the dashboard provides similar capabilities for monitoring sales trends, traffic patterns, and overall store performance in real-time.
Report Example
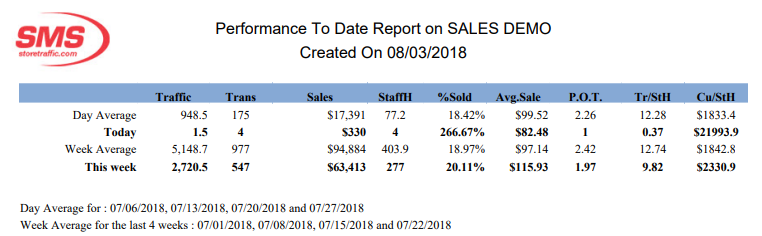
Provides valuable insights such as.
- Identify trends and patterns in sales and traffic.
- Compare current performance against previous periods.
- Make informed decisions to optimize operations and strategies.
Key Metrics
Focuses on several important metrics, including:
- Sales ($): The total revenue generated within the specified period.
- Transactions (#): The number of transactions processed.
- Traffic (QTY): The total number of visitors entering the stores.
- Conversion Rate (%): The percentage of visitors who make a purchase.
- Average Transaction Value ($): The average amount spent per transaction.
Use Case
1. Evaluating Promotional Campaigns:
- Situation: A retail chain runs a promotional campaign and wants to assess its effectiveness.
- Action: The management team generates the PTD Report to compare sales and traffic data during the promotion against previous periods.
- Outcome: The report reveals a significant increase in sales and traffic, confirming the campaign's success.
2. Staffing Adjustments:
- Situation: A store manager notices fluctuating traffic patterns throughout the month.
- Action: By analyzing the PTD Report, the manager identifies peak traffic times and adjusts staffing levels accordingly to ensure optimal customer service.
- Outcome: Improved customer satisfaction and efficient use of staffing resources.
3. Budget Allocation:
- Situation: A company plans its quarterly budget and needs to allocate resources effectively.
- Action: Using the PTD Report, the finance team reviews the performance of each store, identifying high-performing locations that warrant additional investment and underperforming stores that require strategic support.
- Outcome: Optimized budget allocation leads to better resource utilization and improved overall performance.
The PTD Report is an essential tool for tracking and comparing store performance within a specified period. By providing detailed insights into key metrics and enabling comparative analysis, it supports informed decision-making and strategic planning.
How to generate the report
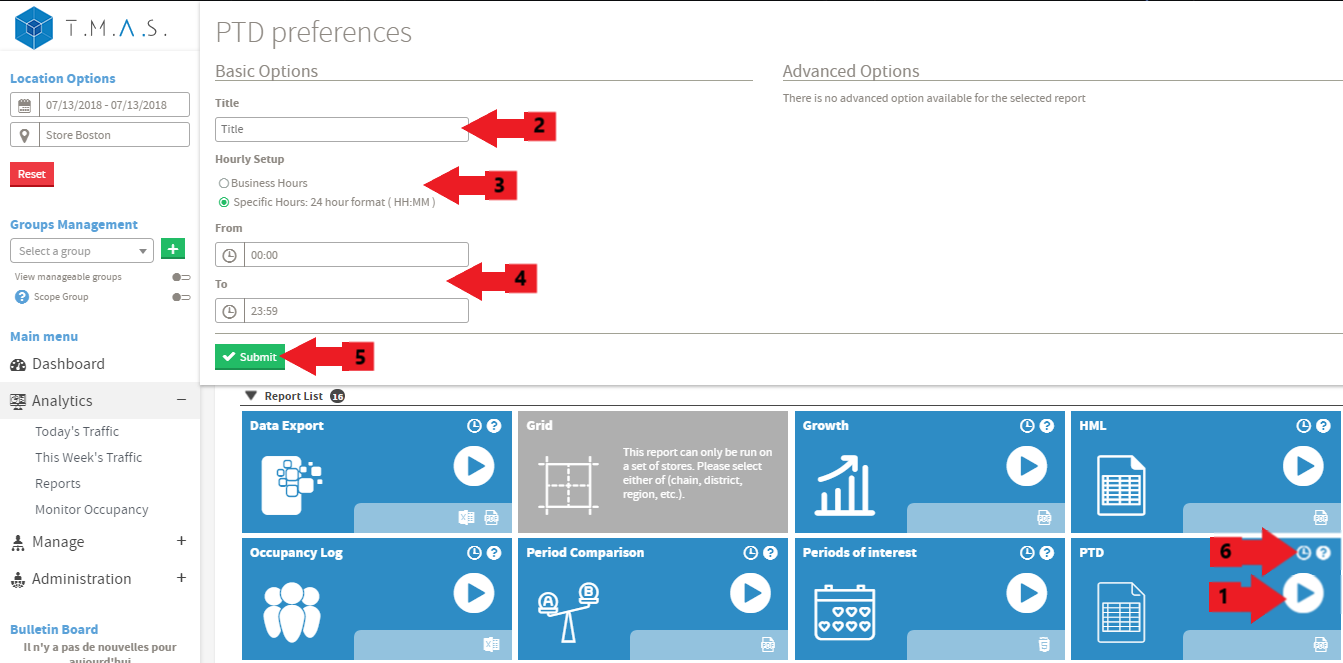
We assume that you have picked the location and date that you want to include in the reports.
- Select the PTD Report.
- Input the title name of your choice, this is optional;
- Click on Business hours or Specific Hours;
- If you selected Specific Hours, Input the desired value;
- Click Submit;
- Click Schedule if you wish to have it automated (See Report Scheduling for more details);