Dos variables
Minoristas: compare la evolución de dos (2) variables a lo largo del tiempo
Table of Contents
Visión general
Similar a la variable única, el gráfico bivariado le permite comparar la evolución de dos (2) puntos de datos de su elección durante el período de tiempo seleccionado.
¿Cómo es esto útil?
Este gráfico es útil para ver la correlación entre dos variables y responder preguntas como:
- ¿El aumento en el tráfico también conduce a un aumento similar en las ventas?
- ¿Tengo la cantidad adecuada de personal (departamento) para igualar mi aumento de tráfico?
¿Quién usaría normalmente este informe?
Todas las personas
No:
No: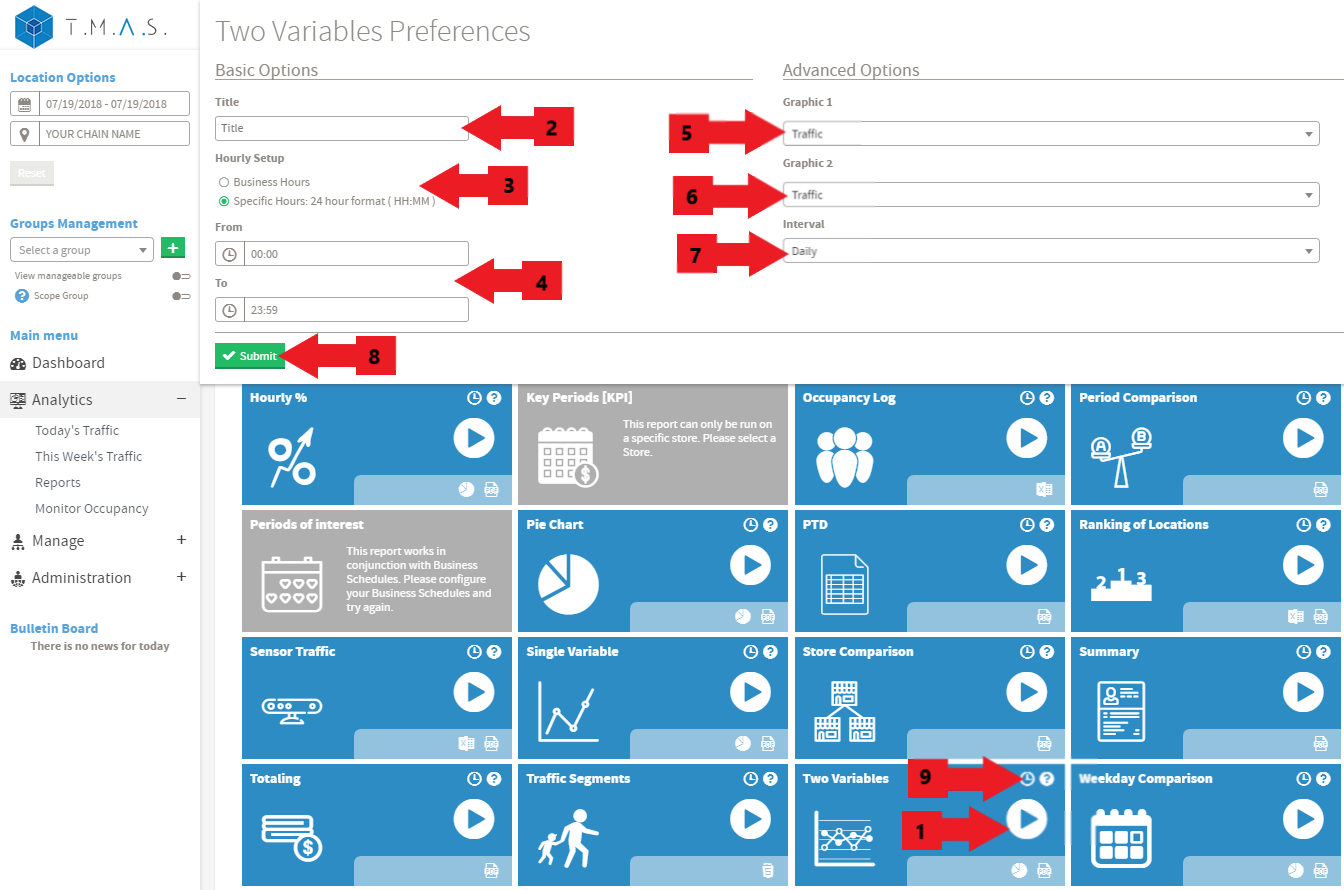
Suponemos que ha elegido la ubicación y la fecha que desea incluir en los informes.
- Seleccione la relación de dos variables.
- Ingrese el nombre del título de su elección, esto es opcional;
- Haga clic en Horarios de apertura u Horarios específicos;
- Si ha seleccionado tiempos específicos, ingrese el valor deseado;
- Seleccione la variable 2 Gráficos TMS para el informe;
- Seleccione el intervalo deseado;
- Seleccione el tipo de gráfico que desee;
- Haga clic en Enviar;
- Haga clic en Programar si desea automatizarlo (consulte Programación de informes para obtener más detalles);
Resultados:
