Analyzing Traffic Trends with the Summary Report
Discover how to use the Summary Report to understand traffic patterns over multiple weeks. This guide helps you generate and analyze reports to gain insights into daily and weekly traffic trends, enhancing your business decisions.
Table of Contents
Overview
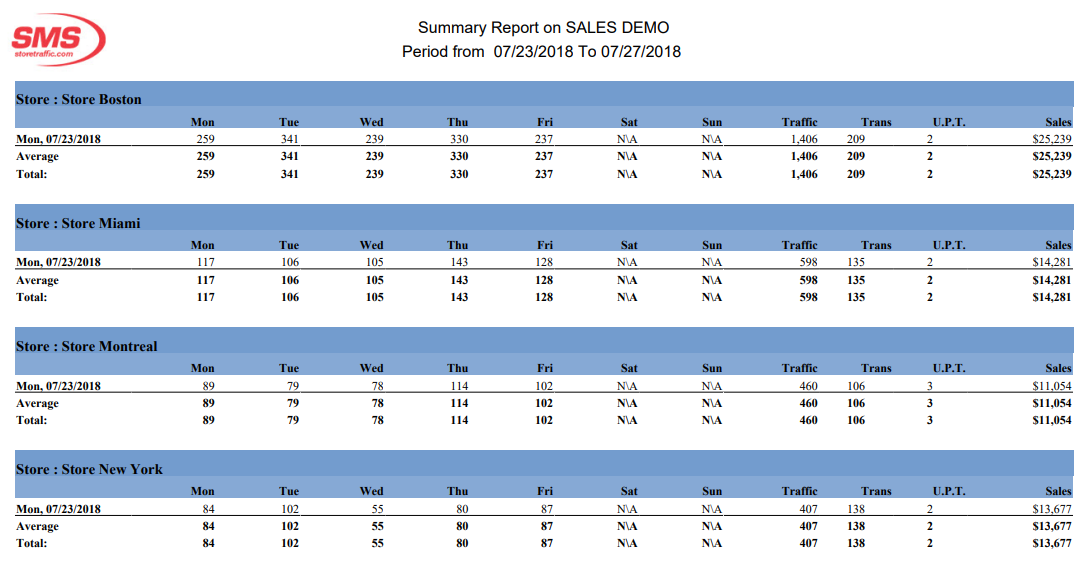
The summary report is similar to a totaling report but with traffic data summarized by day. By running this report on multiple complete weeks it is easy to compare the evolution of traffic during a week and multiple week. For retailers, we also added the sum of sales & staff information for every week.
How is it Useful?
The goal of this report is to understand that traffic flows and buys in predictable pattern. By taking a step back and looking at every weekday across multiple weeks, you can easily understand your day to day traffic pattern, and also question as to why some anomalies (traffic that does not match the pattern) occurred.
Who would normally use this report?
Everyone who wants a "birds-eye" view of their traffic pattern.
Steps:
We will assume that you have picked the location and date that you want to include in the reports.
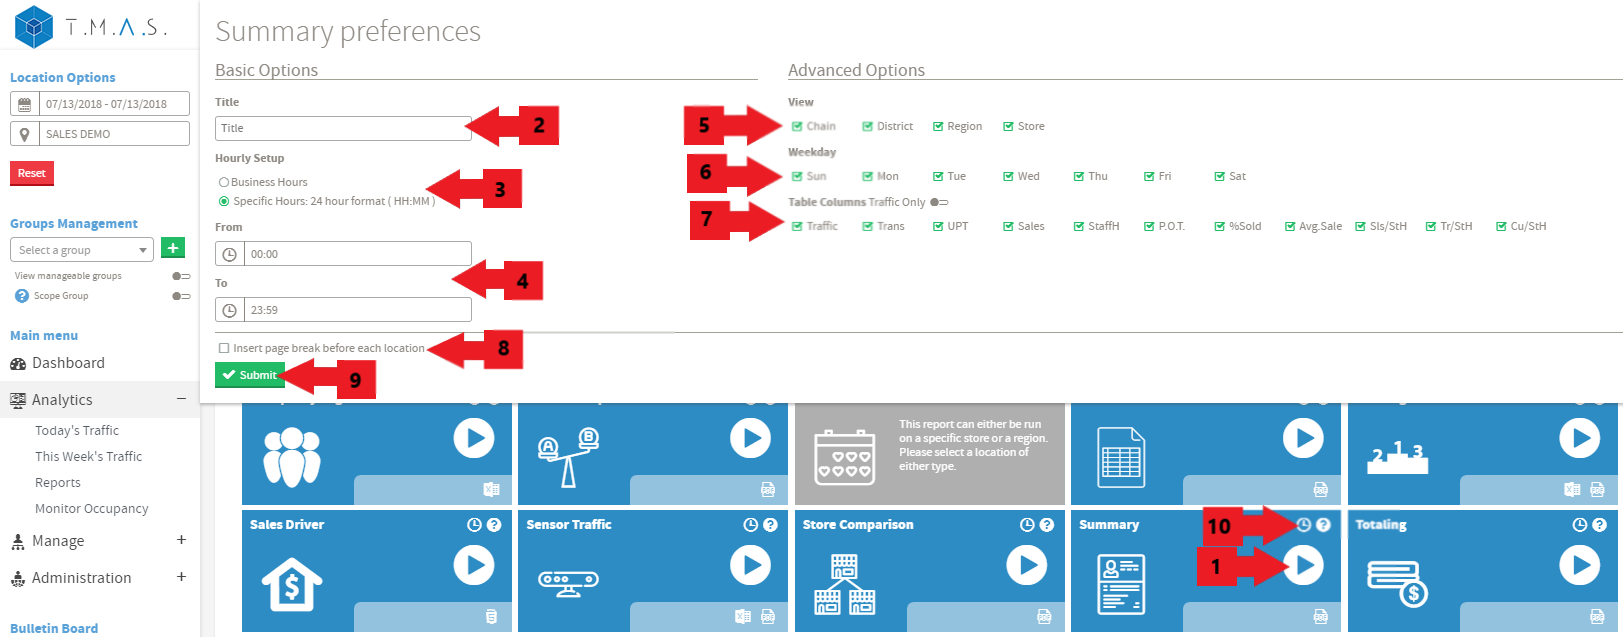
- Select the Summary Report.
- Input the title name of your choice, this is optional;
- Click on Business hours or Specific Hours;
- If you selected Specific Hours, Input the desired value;
- Select the view;
- Select the desired days to include;
- Select the columns you wish to include;
- Select the desired options;
- Click Submit;
-
Click Schedule if you wish to have it automated (See Report Scheduling for more details);
Result: