Sensor Traffic Report
Breakdown of the traffic of your different entrances, including IN/OUT
Table of Contents
Overview
The Sensor Traffic Report offers a simple PDF or Excel view of traffic per sensor, INs and OUTs if directional, aggregated at the desired interval (15, 30, 60 minutes, daily, etc...).
How is it Useful?
This report is useful to understand your traffic patterns for the different entrances in one location, as well as looking at IN or OUT counts in case of a device that supports directional count. The report can be exported to Excel with predetermined filters built-in allowing easy custom analysis.
Who would normally use this report?
This is usually used by Location Managers to understand the traffic flows at each entrance, as well as by the IT team, to troubleshoot or confirm count accuracy by sensor.
Steps:
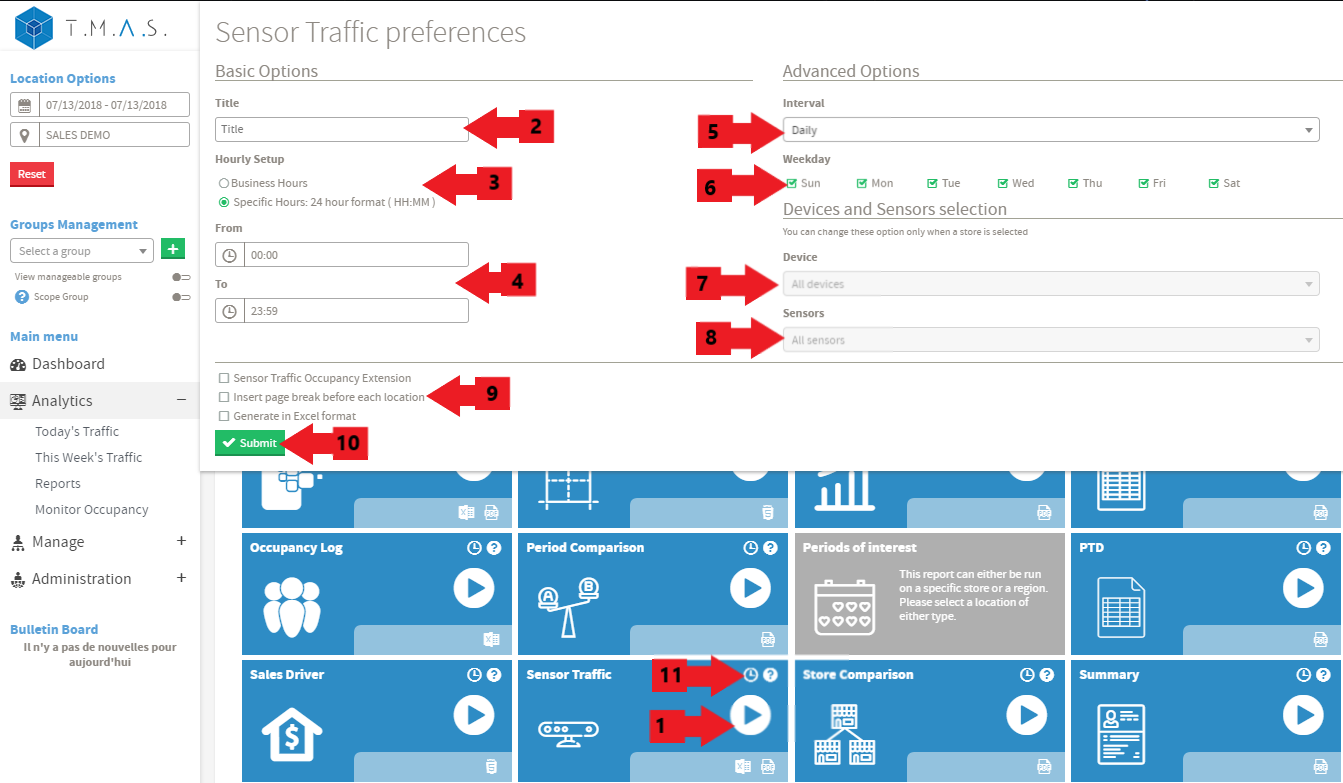
We will assume that you have picked the location and date that you want to include in the reports.
- Select the Sensor Traffic Report.
- Input the title name of your choice, this is optional;
- Click on Business hours or Specific Hours;
- If you selected Specific Hours, Input the desired value;
- Select the desired interval;
- Select the desired days to include;
- Select the devices to include;
- Select the sensor to include;
- Select the desired options; (Note*: Sensor Traffic Occupancy Extension is depreciated, suggestion to use Occupancy Log report instead.)
- Click Submit;
- Click Schedule if you wish to have it automated (See Report Scheduling for more details);
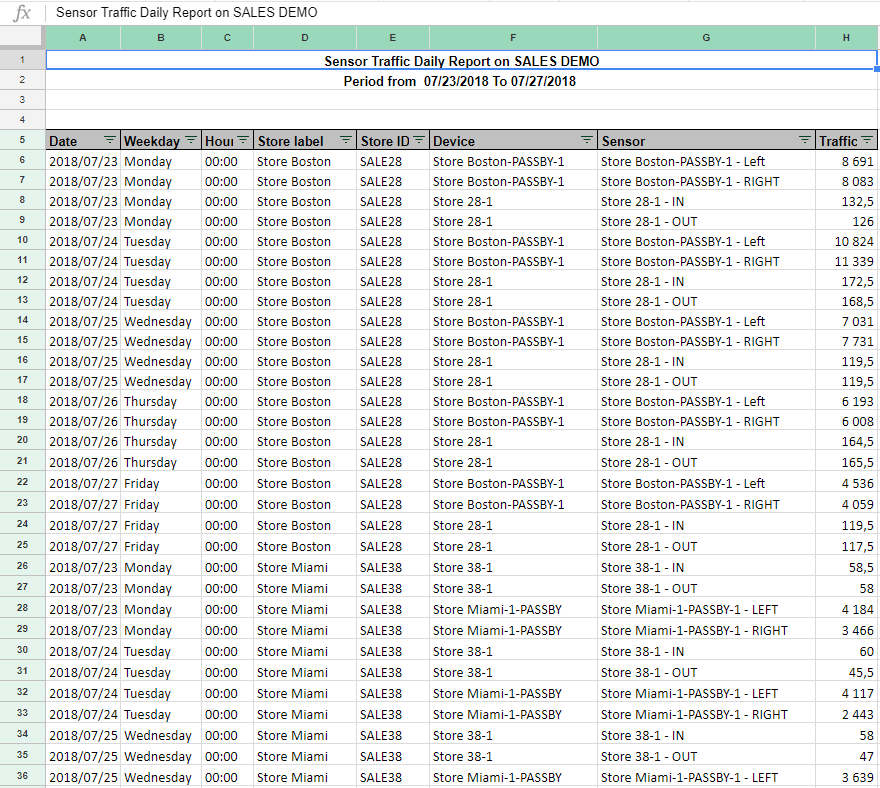
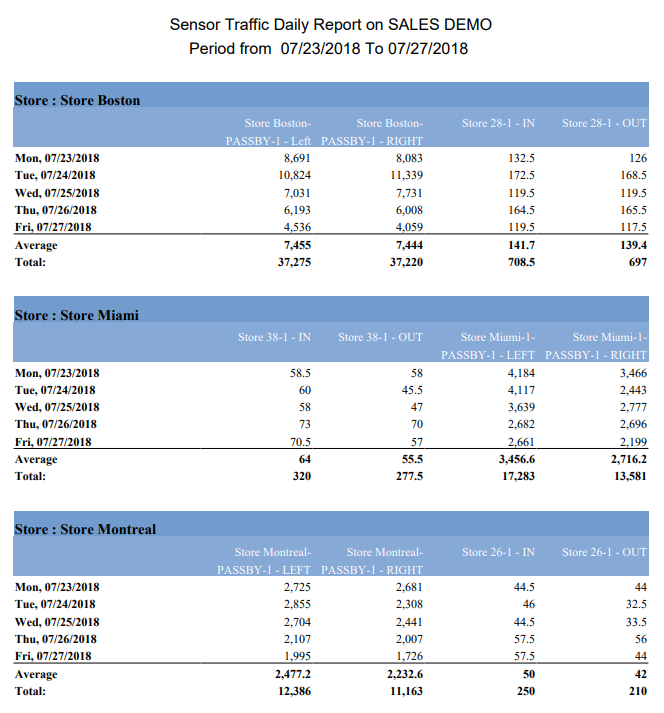
Result (PDF):
Result (Excel):