Occupancy Log
Total People in a location by interval
Table of Contents
Overview
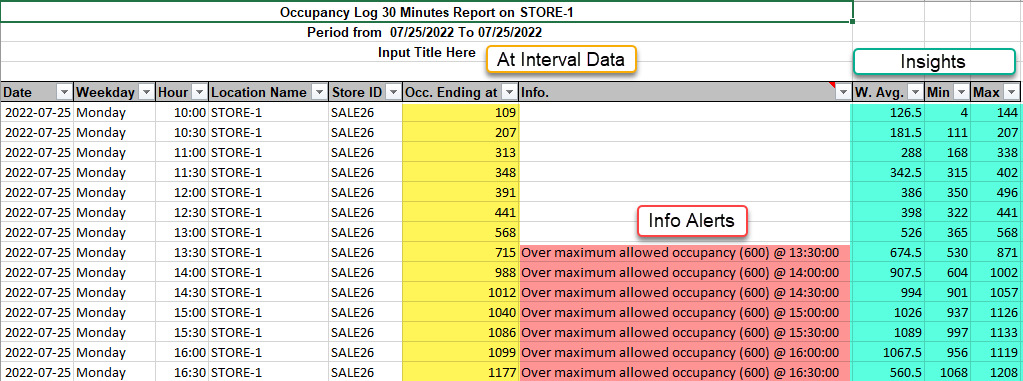
A report detailing the total number of people who occupied the location during the specified time period and selected interval. This report also provides additional metrics just as the MIN / MAX and AVG amount of the for a given interval.
Requirements
- This report is ONLY available for locations which have a bidirectional (IN/OUT) counter installed. Example (3DScope / 3DScope II LC / Pearl).
- Insights columns such as W. Avg / Min / Max requires a Real-Time license subscription and the traffic counter to be in triggered (Real-time mode)
How is it Useful?
Used to determine how many people occupied the location at a given time. This can help to provide insights into space occupancy requirements and compliance as well as if staff scheduling is adequate. Knowing how people use your location provides you with knowledge to make it better.
Who would normally use this report?
Retail Stores, Public locations such as Museums, Libraries, Pools, Municipal Buildings.
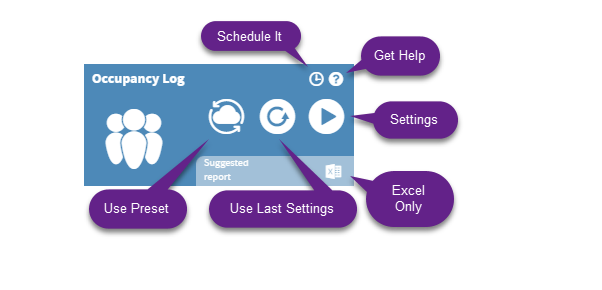
How to generate an Occupancy Log Report:
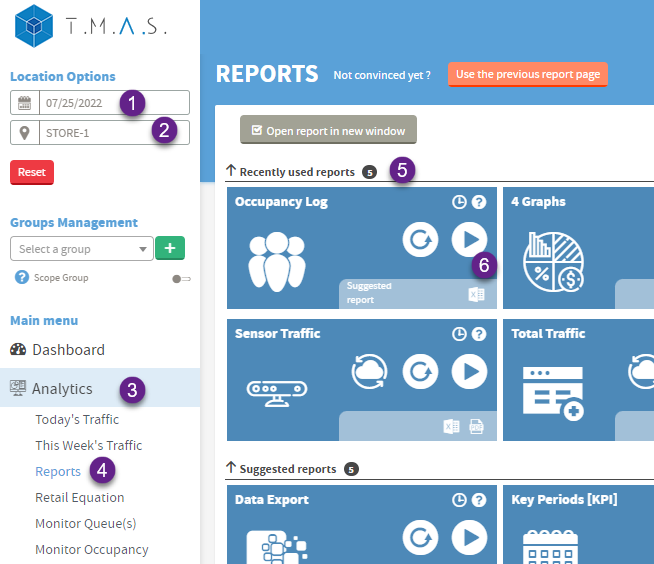 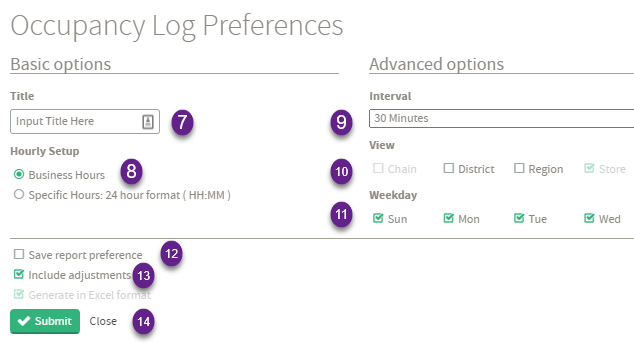  |
|
*Note - This report can be scheduled - Refer to the scheduling a report help article about how to successfully schedule reports.
Corrupt Data
The corrupt column indicates if there were any device outages which may have affected the data during the specific report period. It may also appear in the event you have not set business hours for the location.