Week Distribution Report
Reporting Analytics
Table of Contents
Overview
The Week Distribution report provides a solid analysis of your model in a simple format.
Use this report to:
- At a glance, identify high and low periods within a week
- Understand your traffic patterns as well as all other Key Indicators, permitting you to plan upcoming weeks
- Data is represented in an interactive table, charts and a graph.
Example of the Report
How to generate a Week Distribution Report
- Login to T.M.A.S.
-
Select Date Range
- (Note - If the range does not include a full week, the report will ONLY show the days selected)
- (Note - If the range does NOT include 4 weeks, the Key Periods option will be UNAVAILABLE)
-
Select Location
- (Note - If a Chain, Region or District, is selected, a Location selector box will appear on the report, allowing to view the result for each Location but also for the totals by Region and District. Key Periods is ONLY AVAILABLE when a specific location is selected)
- Select Analytics
- Select Reports
- Select Week Distribution
- Input Title
-
Select Hourly Setup
- (Note - Business Hours need to be setup for the location prior to running this report, if not already done)
-
Select Options (Used to filter report data)
- View - Chain / District / Region or Store
- Weekday - SUN / MON / TUE / WED / THR / FRI / SAT
- How many best/worst intervals to highlight? Default = 5 per variable
-
Select 2 Variables which include the following
- Traffic, Trans, UPT, Sales, StaffH, P.O.T, %Sold
- (Optional) Click Do not calculate Key Periods. Used if NO sales/transactions or staff are being imported.
- Click Generate
Interacting with the Week Distribution Report
This report mimics the functionality of an excel pivot table, allowing the user to Flip through locations and variables without the need of regenerating a report.
Sections of the Report
- Location and Variable Selector
- Data Table
- Pie and Bar Chart Tables
- Line Chart Table
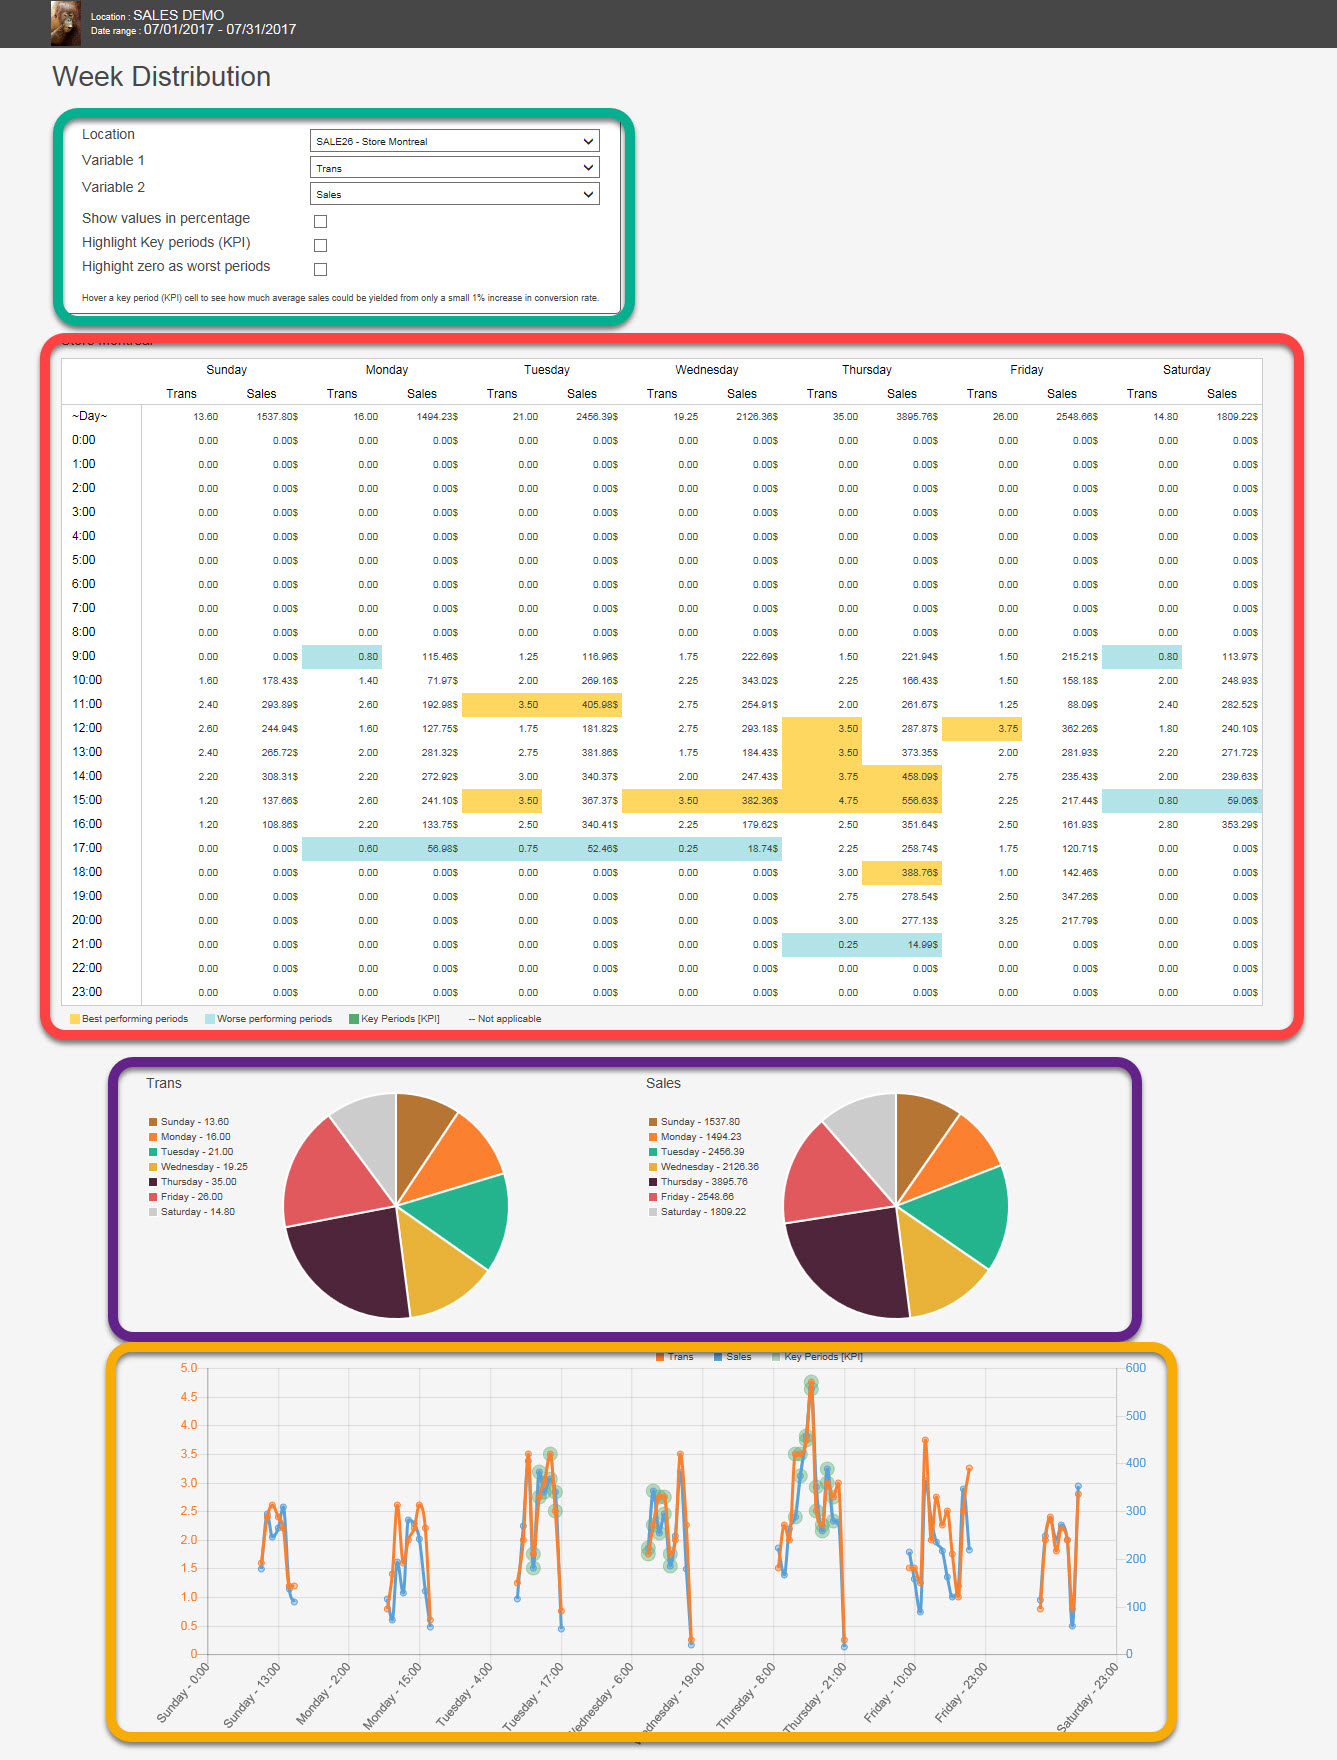
Location and Variable Selector
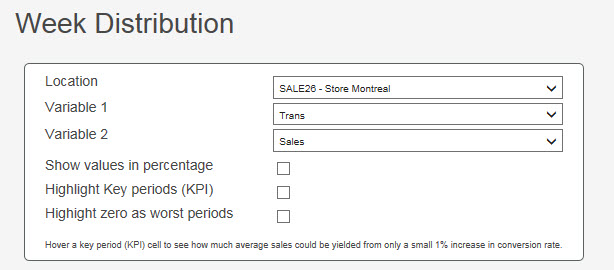
- Location : Select either Chain / District / Region or Store that is found under the previous Location used to generate this report
- Variables: Choose the ones to Display in the report
- Show values in %: When enabled, all the values in the Data Table will be converted to a % from its original value
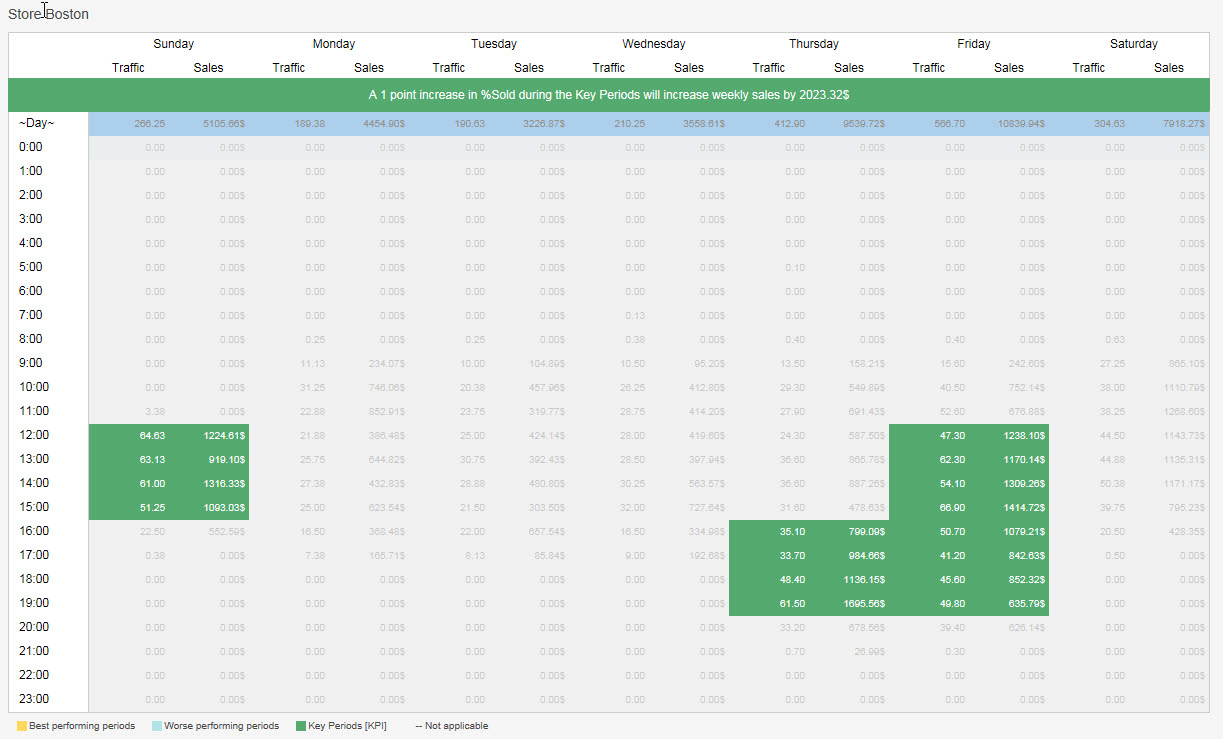
- Highlight Key Periods (KPI): Will show on the report periods throughout the week where if conversion is improved by 1%, it would represent $$$ value more sales. Cells will appear green
- Highlight Zero as worst periods: Best used with business hours applied, will highlight worst periods in blue
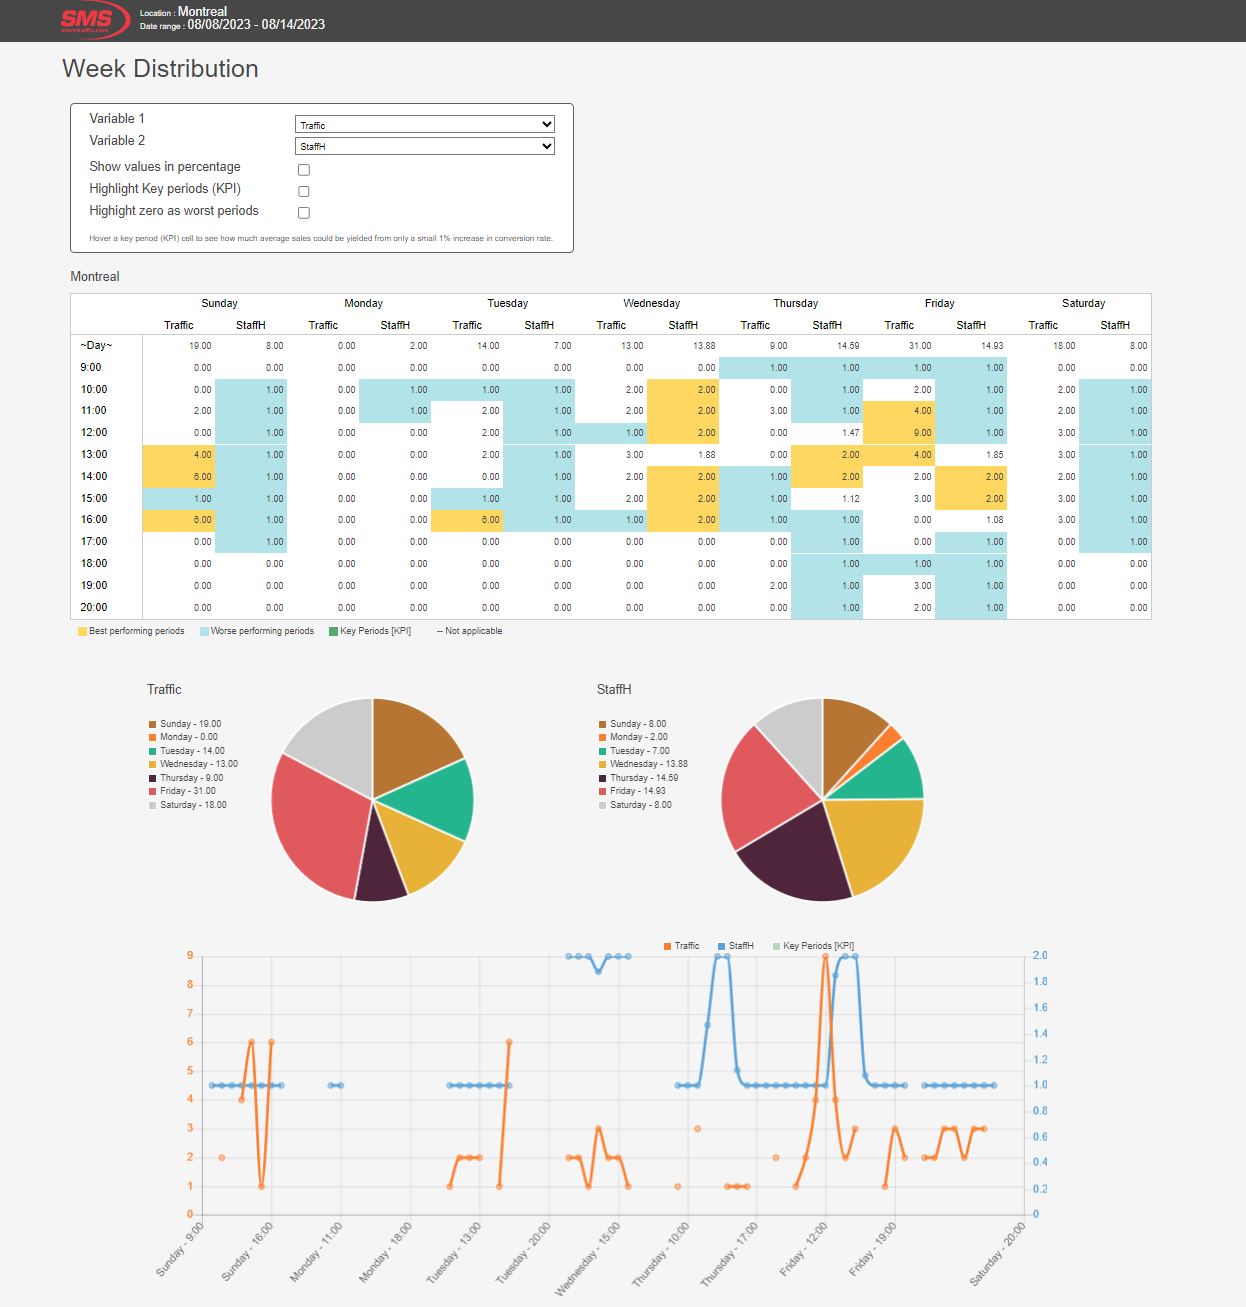
Data Table
Data is displayed depending on the options selected in the Location and Variable selector. The table will show the average for the selected period and provide a daily total per day of the week as well as the hourly breakdown by variable chosen.
Best vs. Worst Periods
Use to quickly find the HOT / COLD periods of the week.
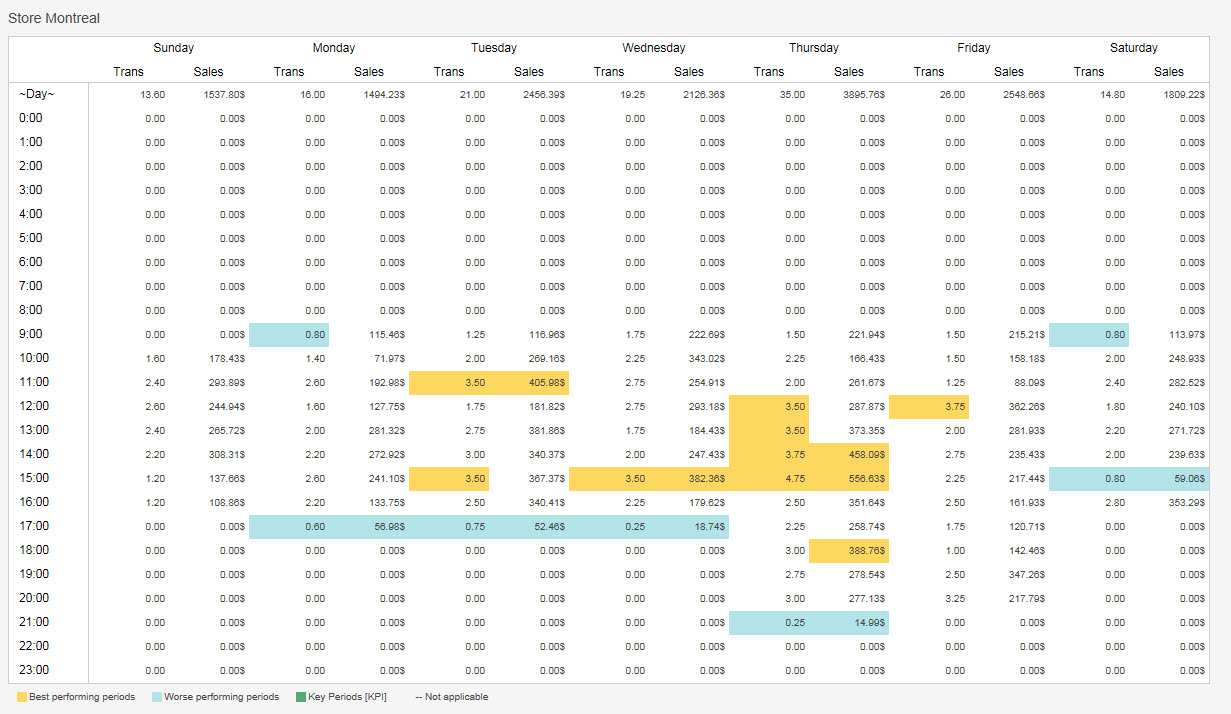
Key Periods
Use to determine when store staffs primary focus should be on serving customers as these are when traffic is expectant to buy. The key periods will always be determined with the four last weeks of your period selection, even if you select more than 4 weeks.
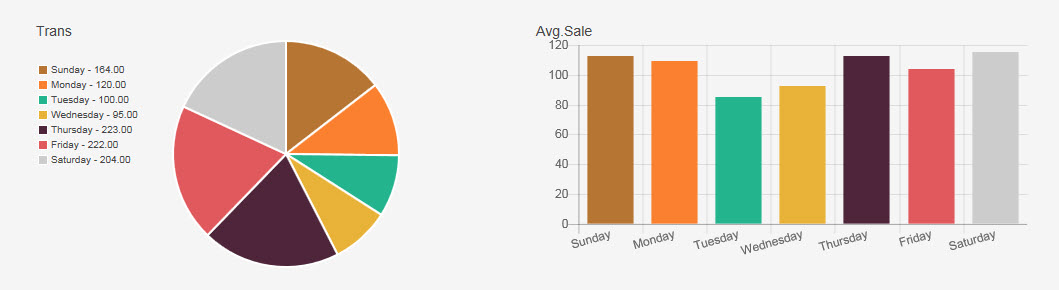
Pie and Bar Charts
Display selected Variables in a pie chart and/or bar graph. Hovering on pie slices or bars will pop out the data used.
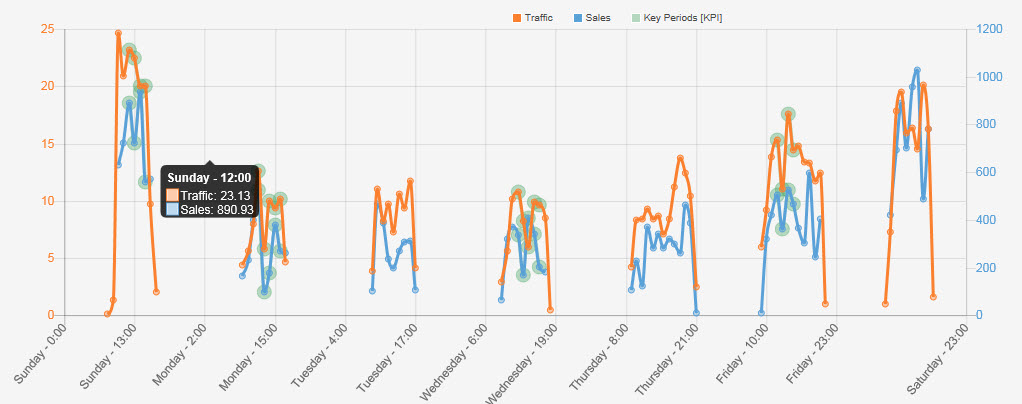
Line Chart
Displays both selected variables as well as highlights KPI with Green Halos. Hovering on points will pop out the data used.