T.M.A.S. log reports (Events / Alerts / Traffic exception)
Learn how to interpret T.M.A.S. log reports to identify events, alerts and traffic exceptions.
Table of Contents
Overview
This article displays where to find the T.M.A.S. log reports, what they do, and how to use them.
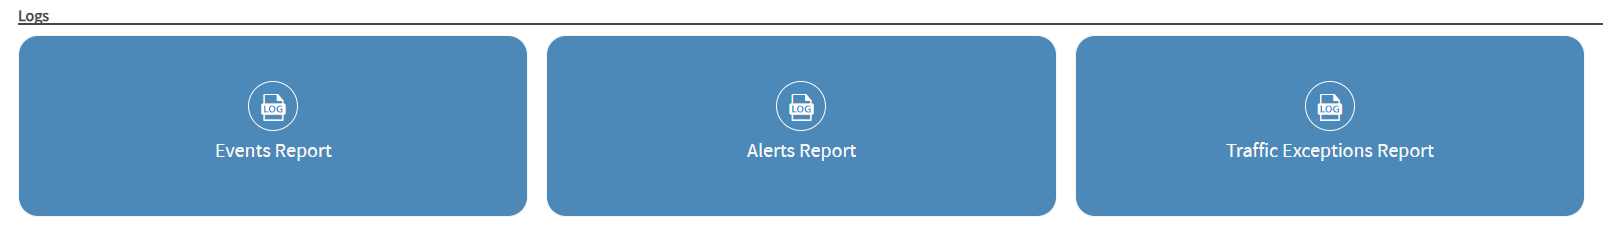
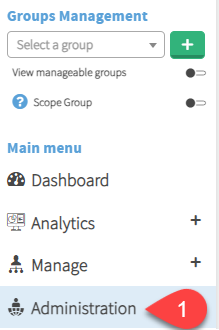
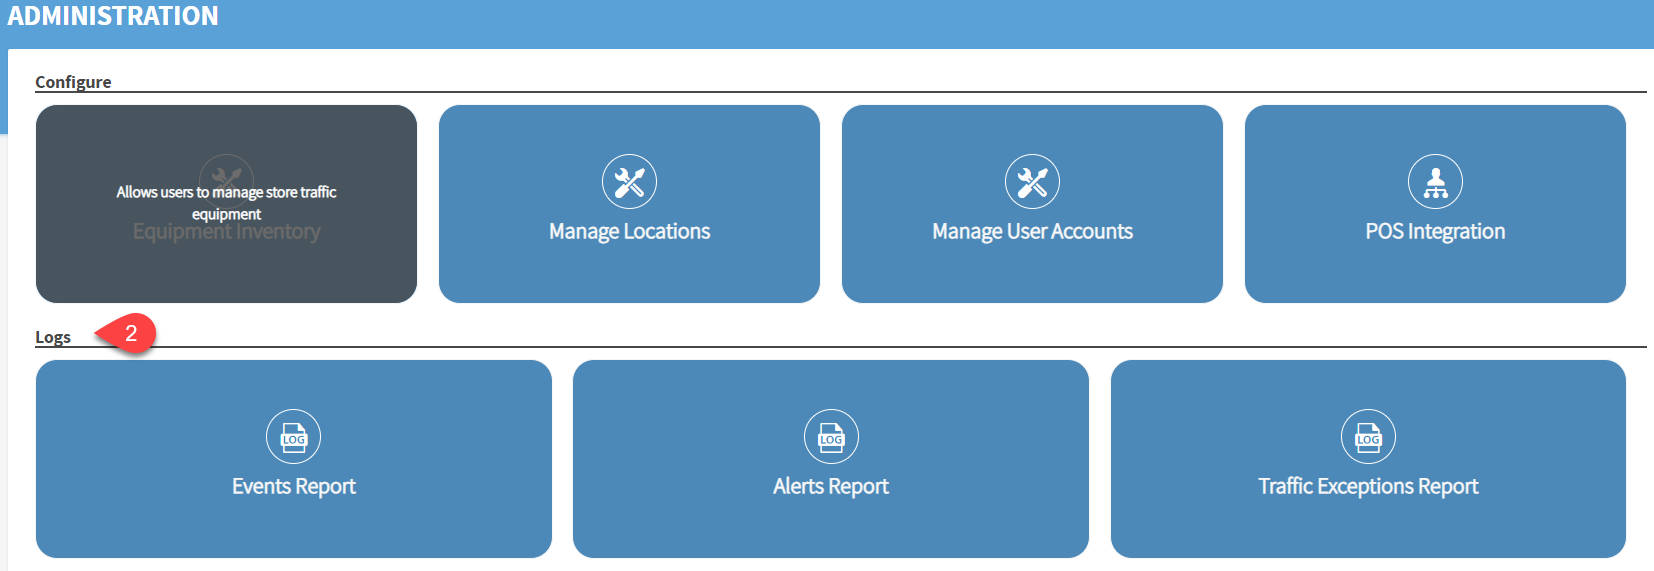
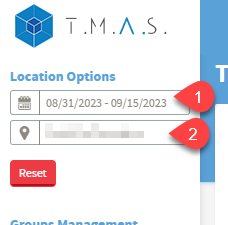
Where to find them
 |
|
 |
Events Reports
T.M.A.S.' Events Reports are as follows
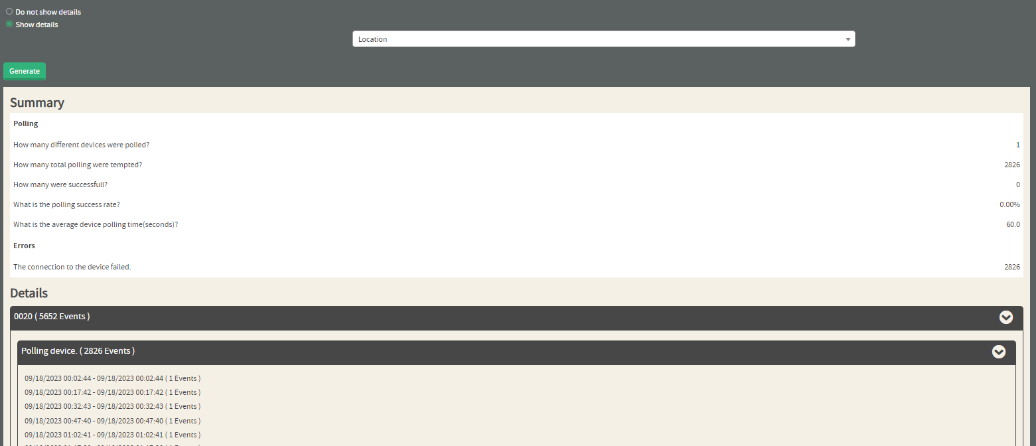
Network Events Report
| What it does |
| Checks for connection success rate of polling devices (STC and 3D SCOPE 1st gen in polling mode only) |
| How to use it |
|
| Example |
 |
Device Events Report
| What it does: | Keeps track of alerts that were sent |
|
How to use it:
|
 |
|
Error Description: The search will show you what alerts were sent and how many of them were sent, per 15-minute interval |
 |
Sensor events report
| What it does: | Checks for Blockage on STC's and PEARLs |
|
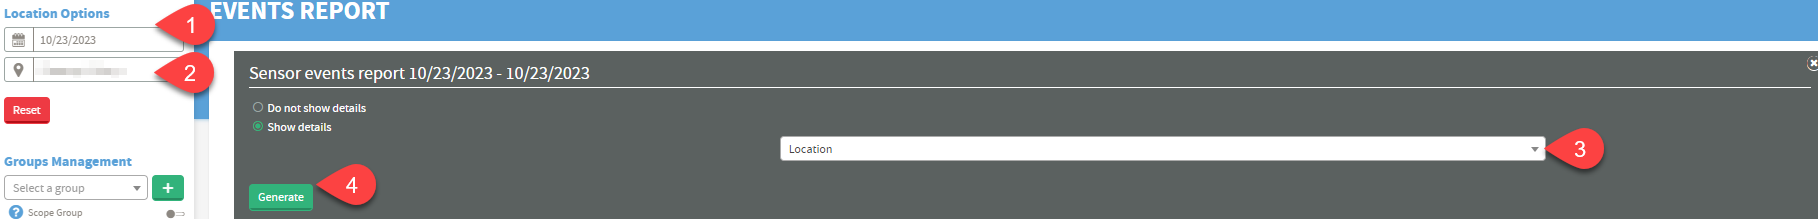
How to use it: 2. Select the location (select chain level if you want the report to be run for all locations). 3. Select “Show Details" and choose either “Location” or “Event” 4. Click “Generate” |
 |
|
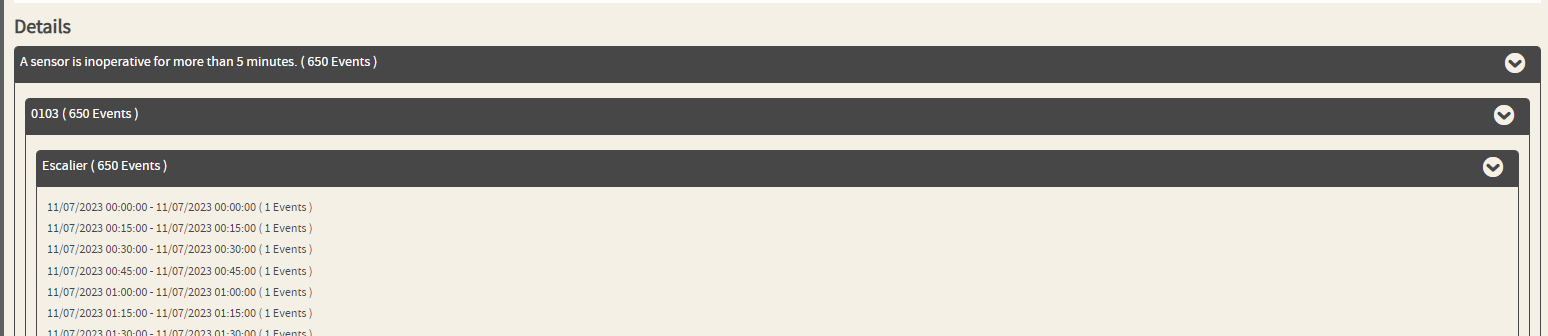
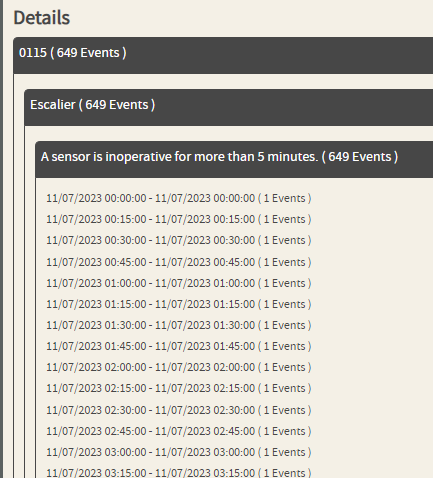
Error Description: If any devices were down, the report will show you how many of them were down, at each 15-minute interval. |
 |
Events List Report
| What it does: | Checks for low battery, low Wi-Fi, device offline, alerts, and blockage events. |
|
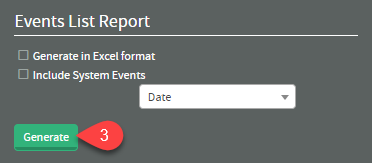
How to use it: 2. Select the location (select chain level if you want the report to be run for all locations). 3. Click “Generate”
NOTE : if Excel sheet is desired, be sure to put checkmark in “Generate in Excel Format” |
  |
| What the report looks like: | 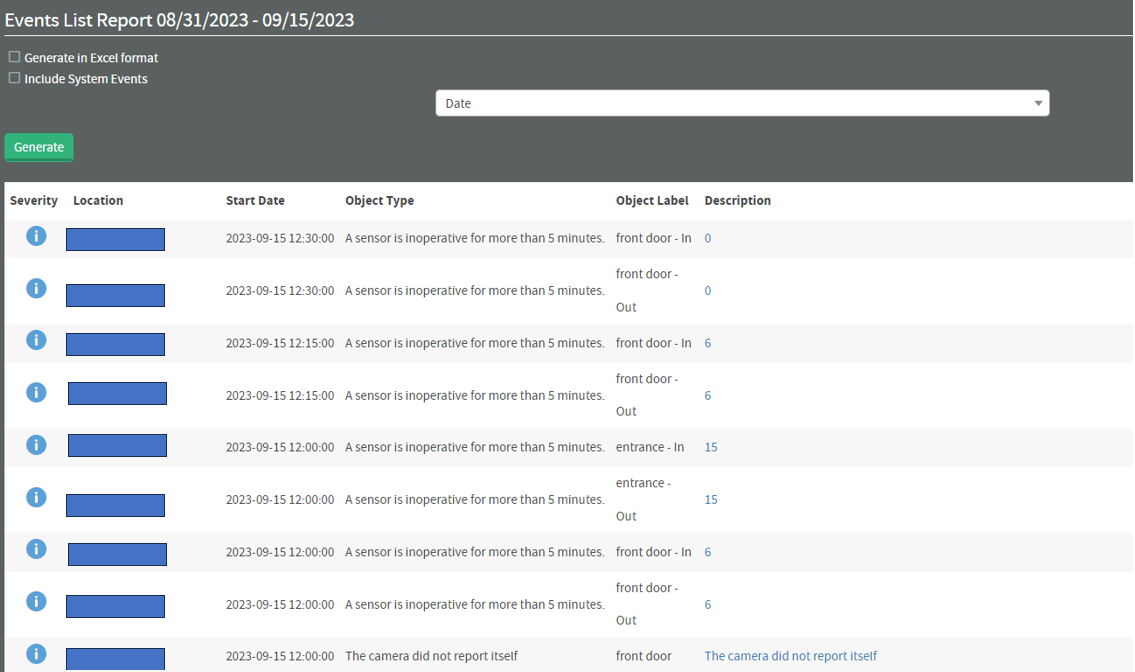 |
ALERTS REPORT
| What it does: | Search for specific alerts that were sent out |
|
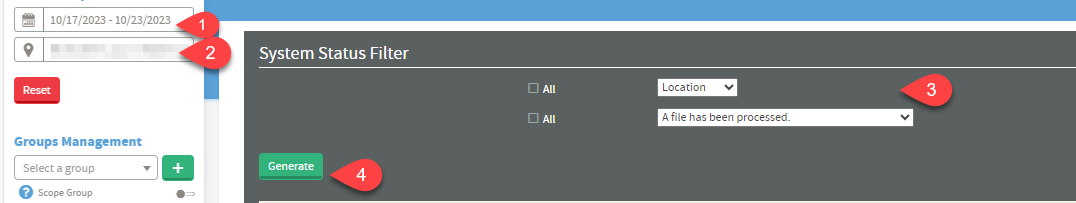
How to use it: 2. Select the location (select chain level if you want the report to be run for all locations). 3. Select the search criteria 4. Click “Generate” 5. A list of Alerts will show up at the bottom, if any were found. |
 |
TRAFFIC EXCEPTIONS REPORT
| What it does: | Runs a query for periods where there was no traffic at any given location |
|
How to use it: 1. Select the date range 2. Select the location (select chain level if you want the report to be run for all locations). 3. Select the Traffic Exceptions that you want to see in the report. 4. Click “Generate” |
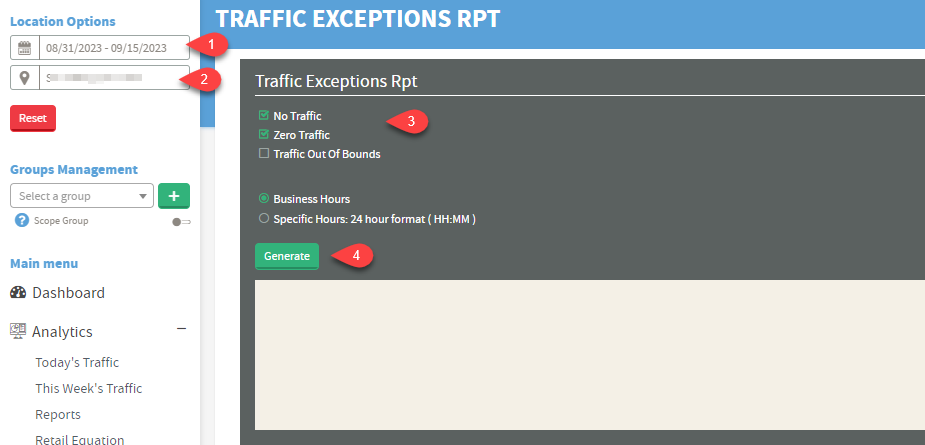 |
| What the report looks like: |  |
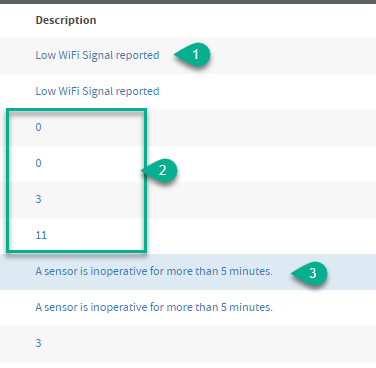
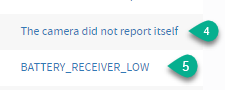
FAQ - What do these Alerts Indicate?
2. Random Numbers (ex. 3, 9, 14, etc.) These alerts represent device blockage This alert is a warning that your device was down for more than 5 minutes, therefore, it is advisable to troubleshoot your PEARLs as soon as possible
5.
Battery_Receiver_Low
|
  |
FAQ
Q: Why did I get a low battery alert after replacing the battery?
A: Sometimes alerts are delayed and sent after the battery has already been replaced. Check the date and time inside the email—if the battery was replaced after that, you can ignore the alert.
MORE INFO